Note
Plotting with Geoplot and GeoPandas#
Geoplot is a Python library providing a selection of easy-to-use geospatial visualizations. It is built on top of the lower-level CartoPy, covered in a separate section of this tutorial, and is designed to work with GeoPandas input.
This example is a brief tour of the geoplot API. For more details on the library refer to its documentation.
First we’ll load in the data using GeoPandas.
[1]:
import geopandas
import geoplot

world = geopandas.read_file(
    geopandas.datasets.get_path('naturalearth_lowres')
)
boroughs = geopandas.read_file(
    geoplot.datasets.get_path('nyc_boroughs')
)
collisions = geopandas.read_file(
    geoplot.datasets.get_path('nyc_injurious_collisions')
)
ERROR 1: PROJ: proj_create_from_database: Open of /home/docs/checkouts/readthedocs.org/user_builds/geopandas/conda/v0.12.0/share/proj failed
Plotting with Geoplot#
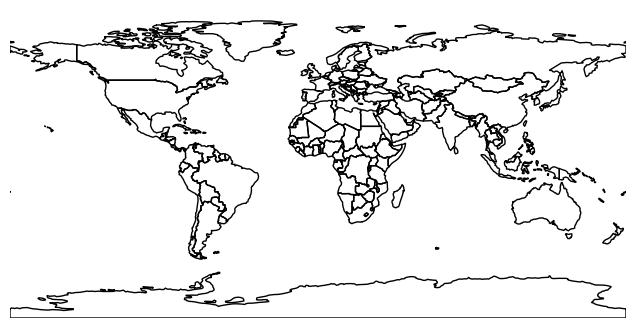
We start out by replicating the basic GeoPandas world plot using Geoplot.
[2]:
geoplot.polyplot(world, figsize=(8, 4))
/home/docs/checkouts/readthedocs.org/user_builds/geopandas/conda/v0.12.0/lib/python3.10/site-packages/geoplot/geoplot.py:885: ShapelyDeprecationWarning: Iteration over multi-part geometries is deprecated and will be removed in Shapely 2.0. Use the `geoms` property to access the constituent parts of a multi-part geometry.
  for subgeom in geom:
[2]:
<AxesSubplot: >
Geoplot can re-project data into any of the map projections provided by CartoPy (see the list here).
[3]:
# use the Orthographic map projection (e.g. a world globe)
ax = geoplot.polyplot(
    world, projection=geoplot.crs.Orthographic(), figsize=(8, 4)
)
ax.outline_patch.set_visible(True)
/home/docs/checkouts/readthedocs.org/user_builds/geopandas/conda/v0.12.0/lib/python3.10/site-packages/geoplot/geoplot.py:703: UserWarning: Plot extent lies outside of the Orthographic projection's viewport. Defaulting to global extent.
  warnings.warn(
/tmp/ipykernel_3733/975099287.py:5: DeprecationWarning: The outline_patch property is deprecated. Use GeoAxes.spines['geo'] or the default Axes properties instead.
  ax.outline_patch.set_visible(True)
Error in callback <function _draw_all_if_interactive at 0x7f552bd5fbe0> (for post_execute):
---------------------------------------------------------------------------
AttributeError                            Traceback (most recent call last)
File ~/checkouts/readthedocs.org/user_builds/geopandas/conda/v0.12.0/lib/python3.10/site-packages/matplotlib/pyplot.py:119, in _draw_all_if_interactive()
    117 def _draw_all_if_interactive():
    118     if matplotlib.is_interactive():
--> 119         draw_all()

File ~/checkouts/readthedocs.org/user_builds/geopandas/conda/v0.12.0/lib/python3.10/site-packages/matplotlib/_pylab_helpers.py:132, in Gcf.draw_all(cls, force)
    130 for manager in cls.get_all_fig_managers():
    131     if force or manager.canvas.figure.stale:
--> 132         manager.canvas.draw_idle()

File ~/checkouts/readthedocs.org/user_builds/geopandas/conda/v0.12.0/lib/python3.10/site-packages/matplotlib/backend_bases.py:2054, in FigureCanvasBase.draw_idle(self, *args, **kwargs)
   2052 if not self._is_idle_drawing:
   2053     with self._idle_draw_cntx():
-> 2054         self.draw(*args, **kwargs)

File ~/checkouts/readthedocs.org/user_builds/geopandas/conda/v0.12.0/lib/python3.10/site-packages/matplotlib/backends/backend_agg.py:408, in FigureCanvasAgg.draw(self)
    404 # Acquire a lock on the shared font cache.
    405 with RendererAgg.lock, \
    406      (self.toolbar._wait_cursor_for_draw_cm() if self.toolbar
    407       else nullcontext()):
--> 408     self.figure.draw(self.renderer)
    409     # A GUI class may be need to update a window using this draw, so
    410     # don't forget to call the superclass.
    411     super().draw()

File ~/checkouts/readthedocs.org/user_builds/geopandas/conda/v0.12.0/lib/python3.10/site-packages/matplotlib/artist.py:74, in _finalize_rasterization.<locals>.draw_wrapper(artist, renderer, *args, **kwargs)
     72 @wraps(draw)
     73 def draw_wrapper(artist, renderer, *args, **kwargs):
---> 74     result = draw(artist, renderer, *args, **kwargs)
     75     if renderer._rasterizing:
     76         renderer.stop_rasterizing()

File ~/checkouts/readthedocs.org/user_builds/geopandas/conda/v0.12.0/lib/python3.10/site-packages/matplotlib/artist.py:51, in allow_rasterization.<locals>.draw_wrapper(artist, renderer)
     48     if artist.get_agg_filter() is not None:
     49         renderer.start_filter()
---> 51     return draw(artist, renderer)
     52 finally:
     53     if artist.get_agg_filter() is not None:

File ~/checkouts/readthedocs.org/user_builds/geopandas/conda/v0.12.0/lib/python3.10/site-packages/matplotlib/figure.py:3074, in Figure.draw(self, renderer)
   3071         # ValueError can occur when resizing a window.
   3073 self.patch.draw(renderer)
-> 3074 mimage._draw_list_compositing_images(
   3075     renderer, self, artists, self.suppressComposite)
   3077 for sfig in self.subfigs:
   3078     sfig.draw(renderer)

File ~/checkouts/readthedocs.org/user_builds/geopandas/conda/v0.12.0/lib/python3.10/site-packages/matplotlib/image.py:131, in _draw_list_compositing_images(renderer, parent, artists, suppress_composite)
    129 if not_composite or not has_images:
    130     for a in artists:
--> 131         a.draw(renderer)
    132 else:
    133     # Composite any adjacent images together
    134     image_group = []

File ~/checkouts/readthedocs.org/user_builds/geopandas/conda/v0.12.0/lib/python3.10/site-packages/matplotlib/artist.py:51, in allow_rasterization.<locals>.draw_wrapper(artist, renderer)
     48     if artist.get_agg_filter() is not None:
     49         renderer.start_filter()
---> 51     return draw(artist, renderer)
     52 finally:
     53     if artist.get_agg_filter() is not None:

File ~/checkouts/readthedocs.org/user_builds/geopandas/conda/v0.12.0/lib/python3.10/site-packages/cartopy/mpl/geoaxes.py:543, in GeoAxes.draw(self, renderer, **kwargs)
    535 """
    536 Extend the standard behaviour of :func:`matplotlib.axes.Axes.draw`.
    537
   (...)
    540 been set.
    541 """
    542 # Shared processing steps
--> 543 self._draw_preprocess(renderer)
    545 # XXX This interface needs a tidy up:
    546 #       image drawing on pan/zoom;
    547 #       caching the resulting image;
    548 #       buffering the result by 10%...;
    549 if not self._done_img_factory:

File ~/checkouts/readthedocs.org/user_builds/geopandas/conda/v0.12.0/lib/python3.10/site-packages/cartopy/mpl/geoaxes.py:509, in GeoAxes._draw_preprocess(self, renderer)
    506 # If data has been added (i.e. autoscale hasn't been turned off)
    507 # then we should autoscale the view.
    508 if self.get_autoscale_on() and self.ignore_existing_data_limits:
--> 509     self.autoscale_view()
    511 # Adjust location of background patch so that new gridlines below are
    512 # clipped correctly.
    513 self.patch._adjust_location()

File ~/checkouts/readthedocs.org/user_builds/geopandas/conda/v0.12.0/lib/python3.10/site-packages/cartopy/mpl/geoaxes.py:946, in GeoAxes.autoscale_view(self, tight, scalex, scaley)
    943 matplotlib.axes.Axes.autoscale_view(self, tight=tight,
    944                                     scalex=scalex, scaley=scaley)
    945 # Limit the resulting bounds to valid area.
--> 946 if scalex and self._autoscaleXon:
    947     bounds = self.get_xbound()
    948     self.set_xbound(max(bounds[0], self.projection.x_limits[0]),
    949                     min(bounds[1], self.projection.x_limits[1]))

AttributeError: 'GeoAxesSubplot' object has no attribute '_autoscaleXon'
---------------------------------------------------------------------------
AttributeError                            Traceback (most recent call last)
File ~/checkouts/readthedocs.org/user_builds/geopandas/conda/v0.12.0/lib/python3.10/site-packages/IPython/core/formatters.py:339, in BaseFormatter.__call__(self, obj)
    337     pass
    338 else:
--> 339     return printer(obj)
    340 # Finally look for special method names
    341 method = get_real_method(obj, self.print_method)

File ~/checkouts/readthedocs.org/user_builds/geopandas/conda/v0.12.0/lib/python3.10/site-packages/IPython/core/pylabtools.py:151, in print_figure(fig, fmt, bbox_inches, base64, **kwargs)
    148     from matplotlib.backend_bases import FigureCanvasBase
    149     FigureCanvasBase(fig)
--> 151 fig.canvas.print_figure(bytes_io, **kw)
    152 data = bytes_io.getvalue()
    153 if fmt == 'svg':

File ~/checkouts/readthedocs.org/user_builds/geopandas/conda/v0.12.0/lib/python3.10/site-packages/matplotlib/backend_bases.py:2314, in FigureCanvasBase.print_figure(self, filename, dpi, facecolor, edgecolor, orientation, format, bbox_inches, pad_inches, bbox_extra_artists, backend, **kwargs)
   2308     renderer = _get_renderer(
   2309         self.figure,
   2310         functools.partial(
   2311             print_method, orientation=orientation)
   2312     )
   2313     with getattr(renderer, "_draw_disabled", nullcontext)():
-> 2314         self.figure.draw(renderer)
   2316 if bbox_inches:
   2317     if bbox_inches == "tight":

File ~/checkouts/readthedocs.org/user_builds/geopandas/conda/v0.12.0/lib/python3.10/site-packages/matplotlib/artist.py:74, in _finalize_rasterization.<locals>.draw_wrapper(artist, renderer, *args, **kwargs)
     72 @wraps(draw)
     73 def draw_wrapper(artist, renderer, *args, **kwargs):
---> 74     result = draw(artist, renderer, *args, **kwargs)
     75     if renderer._rasterizing:
     76         renderer.stop_rasterizing()

File ~/checkouts/readthedocs.org/user_builds/geopandas/conda/v0.12.0/lib/python3.10/site-packages/matplotlib/artist.py:51, in allow_rasterization.<locals>.draw_wrapper(artist, renderer)
     48     if artist.get_agg_filter() is not None:
     49         renderer.start_filter()
---> 51     return draw(artist, renderer)
     52 finally:
     53     if artist.get_agg_filter() is not None:

File ~/checkouts/readthedocs.org/user_builds/geopandas/conda/v0.12.0/lib/python3.10/site-packages/matplotlib/figure.py:3074, in Figure.draw(self, renderer)
   3071         # ValueError can occur when resizing a window.
   3073 self.patch.draw(renderer)
-> 3074 mimage._draw_list_compositing_images(
   3075     renderer, self, artists, self.suppressComposite)
   3077 for sfig in self.subfigs:
   3078     sfig.draw(renderer)

File ~/checkouts/readthedocs.org/user_builds/geopandas/conda/v0.12.0/lib/python3.10/site-packages/matplotlib/image.py:131, in _draw_list_compositing_images(renderer, parent, artists, suppress_composite)
    129 if not_composite or not has_images:
    130     for a in artists:
--> 131         a.draw(renderer)
    132 else:
    133     # Composite any adjacent images together
    134     image_group = []

File ~/checkouts/readthedocs.org/user_builds/geopandas/conda/v0.12.0/lib/python3.10/site-packages/matplotlib/artist.py:51, in allow_rasterization.<locals>.draw_wrapper(artist, renderer)
     48     if artist.get_agg_filter() is not None:
     49         renderer.start_filter()
---> 51     return draw(artist, renderer)
     52 finally:
     53     if artist.get_agg_filter() is not None:

File ~/checkouts/readthedocs.org/user_builds/geopandas/conda/v0.12.0/lib/python3.10/site-packages/cartopy/mpl/geoaxes.py:543, in GeoAxes.draw(self, renderer, **kwargs)
    535 """
    536 Extend the standard behaviour of :func:`matplotlib.axes.Axes.draw`.
    537
   (...)
    540 been set.
    541 """
    542 # Shared processing steps
--> 543 self._draw_preprocess(renderer)
    545 # XXX This interface needs a tidy up:
    546 #       image drawing on pan/zoom;
    547 #       caching the resulting image;
    548 #       buffering the result by 10%...;
    549 if not self._done_img_factory:

File ~/checkouts/readthedocs.org/user_builds/geopandas/conda/v0.12.0/lib/python3.10/site-packages/cartopy/mpl/geoaxes.py:509, in GeoAxes._draw_preprocess(self, renderer)
    506 # If data has been added (i.e. autoscale hasn't been turned off)
    507 # then we should autoscale the view.
    508 if self.get_autoscale_on() and self.ignore_existing_data_limits:
--> 509     self.autoscale_view()
    511 # Adjust location of background patch so that new gridlines below are
    512 # clipped correctly.
    513 self.patch._adjust_location()

File ~/checkouts/readthedocs.org/user_builds/geopandas/conda/v0.12.0/lib/python3.10/site-packages/cartopy/mpl/geoaxes.py:946, in GeoAxes.autoscale_view(self, tight, scalex, scaley)
    943 matplotlib.axes.Axes.autoscale_view(self, tight=tight,
    944                                     scalex=scalex, scaley=scaley)
    945 # Limit the resulting bounds to valid area.
--> 946 if scalex and self._autoscaleXon:
    947     bounds = self.get_xbound()
    948     self.set_xbound(max(bounds[0], self.projection.x_limits[0]),
    949                     min(bounds[1], self.projection.x_limits[1]))

AttributeError: 'GeoAxesSubplot' object has no attribute '_autoscaleXon'
<Figure size 800x400 with 1 Axes>
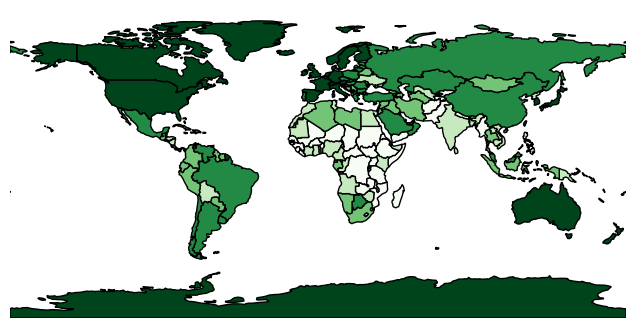
polyplot is trivial and can only plot the geometries you pass to it. If you want to use color as a visual variable, specify a choropleth. Here we sort GDP per person by country into five buckets by color, using “quantiles” binning from the Mapclassify library.
[4]:
import mapclassify
gpd_per_person = world['gdp_md_est'] / world['pop_est']
scheme = mapclassify.Quantiles(gpd_per_person, k=5)

# Note: this code sample requires geoplot>=0.4.0.
geoplot.choropleth(
    world, hue=gpd_per_person, scheme=scheme,
    cmap='Greens', figsize=(8, 4)
)
/home/docs/checkouts/readthedocs.org/user_builds/geopandas/conda/v0.12.0/lib/python3.10/site-packages/geoplot/geoplot.py:982: ShapelyDeprecationWarning: Iteration over multi-part geometries is deprecated and will be removed in Shapely 2.0. Use the `geoms` property to access the constituent parts of a multi-part geometry.
  for subgeom in geom:
[4]:
<AxesSubplot: >
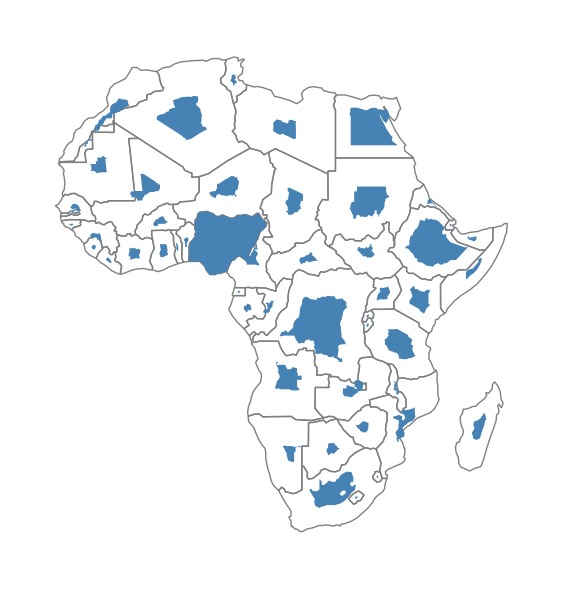
If you want to use size as a visual variable, use a cartogram. Here are population estimates for countries in Africa.
[5]:
africa = world.query('continent == "Africa"')
ax = geoplot.cartogram(
    africa, scale='pop_est', limits=(0.2, 1),
    edgecolor='None', figsize=(7, 8)
)
geoplot.polyplot(africa, edgecolor='gray', ax=ax)
/home/docs/checkouts/readthedocs.org/user_builds/geopandas/conda/v0.12.0/lib/python3.10/site-packages/geoplot/geoplot.py:1233: ShapelyDeprecationWarning: Iteration over multi-part geometries is deprecated and will be removed in Shapely 2.0. Use the `geoms` property to access the constituent parts of a multi-part geometry.
  for subgeom in scaled_polygon:
/home/docs/checkouts/readthedocs.org/user_builds/geopandas/conda/v0.12.0/lib/python3.10/site-packages/geoplot/geoplot.py:885: ShapelyDeprecationWarning: Iteration over multi-part geometries is deprecated and will be removed in Shapely 2.0. Use the `geoms` property to access the constituent parts of a multi-part geometry.
  for subgeom in geom:
[5]:
<AxesSubplot: >
If we have data in the shape of points in space, we may generate a three-dimensional heatmap on it using kdeplot.
[6]:
ax = geoplot.kdeplot(
    collisions.head(1000), clip=boroughs.geometry,
    shade=True, cmap='Reds',
    projection=geoplot.crs.AlbersEqualArea())
geoplot.polyplot(boroughs, ax=ax, zorder=1)
---------------------------------------------------------------------------
AttributeError                            Traceback (most recent call last)
Cell In [6], line 1
----> 1 ax = geoplot.kdeplot(
      2     collisions.head(1000), clip=boroughs.geometry,
      3     shade=True, cmap='Reds',
      4     projection=geoplot.crs.AlbersEqualArea())
      5 geoplot.polyplot(boroughs, ax=ax, zorder=1)

File ~/checkouts/readthedocs.org/user_builds/geopandas/conda/v0.12.0/lib/python3.10/site-packages/geoplot/geoplot.py:1317, in kdeplot(df, projection, extent, figsize, ax, clip, **kwargs)
   1310             sns.kdeplot(
   1311                 x=pd.Series([p.x for p in self.df.geometry]),
   1312                 y=pd.Series([p.y for p in self.df.geometry]),
   1313                 ax=ax, **self.kwargs
   1314             )
   1315         return ax
-> 1317 plot = KDEPlot(
   1318     df, projection=projection, extent=extent, figsize=figsize, ax=ax, clip=clip, **kwargs
   1319 )
   1320 return plot.draw()

File ~/checkouts/readthedocs.org/user_builds/geopandas/conda/v0.12.0/lib/python3.10/site-packages/geoplot/geoplot.py:1296, in kdeplot.<locals>.KDEPlot.__init__(self, df, **kwargs)
   1294 def __init__(self, df, **kwargs):
   1295     super().__init__(df, **kwargs)
-> 1296     self.paint_clip()

File ~/checkouts/readthedocs.org/user_builds/geopandas/conda/v0.12.0/lib/python3.10/site-packages/geoplot/geoplot.py:508, in ClipMixin.paint_clip(self)
    506 if clip is not None:
    507     if self.projection is not None:
--> 508         xmin, xmax, ymin, ymax = self.ax.get_extent(crs=ccrs.PlateCarree())
    509         extent = (xmin, ymin, xmax, ymax)
    510         clip_geom = self._get_clip(extent, clip)

File ~/checkouts/readthedocs.org/user_builds/geopandas/conda/v0.12.0/lib/python3.10/site-packages/cartopy/mpl/geoaxes.py:814, in GeoAxes.get_extent(self, crs)
    805 def get_extent(self, crs=None):
    806     """
    807     Get the extent (x0, x1, y0, y1) of the map in the given coordinate
    808     system.
   (...)
    812
    813     """
--> 814     p = self._get_extent_geom(crs)
    815     r = p.bounds
    816     x1, y1, x2, y2 = r

File ~/checkouts/readthedocs.org/user_builds/geopandas/conda/v0.12.0/lib/python3.10/site-packages/cartopy/mpl/geoaxes.py:821, in GeoAxes._get_extent_geom(self, crs)
    819 def _get_extent_geom(self, crs=None):
    820     # Perform the calculations for get_extent(), which just repackages it.
--> 821     with self.hold_limits():
    822         if self.get_autoscale_on():
    823             self.autoscale_view()

File ~/checkouts/readthedocs.org/user_builds/geopandas/conda/v0.12.0/lib/python3.10/contextlib.py:135, in _GeneratorContextManager.__enter__(self)
    133 del self.args, self.kwds, self.func
    134 try:
--> 135     return next(self.gen)
    136 except StopIteration:
    137     raise RuntimeError("generator didn't yield") from None

File ~/checkouts/readthedocs.org/user_builds/geopandas/conda/v0.12.0/lib/python3.10/site-packages/cartopy/mpl/geoaxes.py:491, in GeoAxes.hold_limits(self, hold)
    488 data_lim = self.dataLim.frozen().get_points()
    489 view_lim = self.viewLim.frozen().get_points()
    490 other = (self.ignore_existing_data_limits,
--> 491          self._autoscaleXon, self._autoscaleYon)
    492 try:
    493     yield

AttributeError: 'GeoAxesSubplot' object has no attribute '_autoscaleXon'

These are just some of the plots you can make with Geoplot. There are many other possibilities not covered in this brief introduction. For more examples, refer to the Gallery in the Geoplot documentation.