Examples Gallery#
The following examples show off the functionality in GeoPandas. They highlight many of the things you can do with this package, and show off some best-practices.
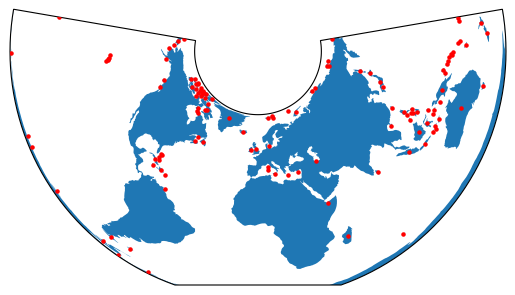
Plotting with CartoPy and GeoPandas
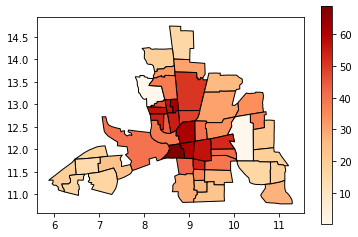
Choro legends
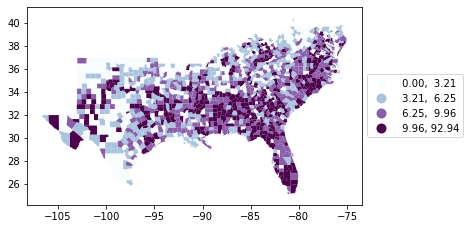
Choropleth classification schemes from PySAL for use with GeoPandas
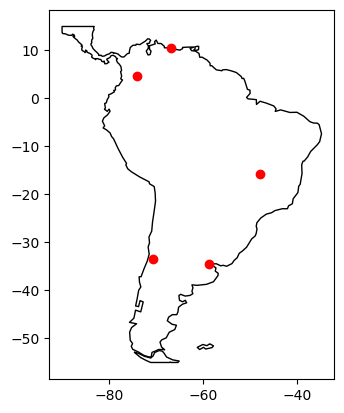
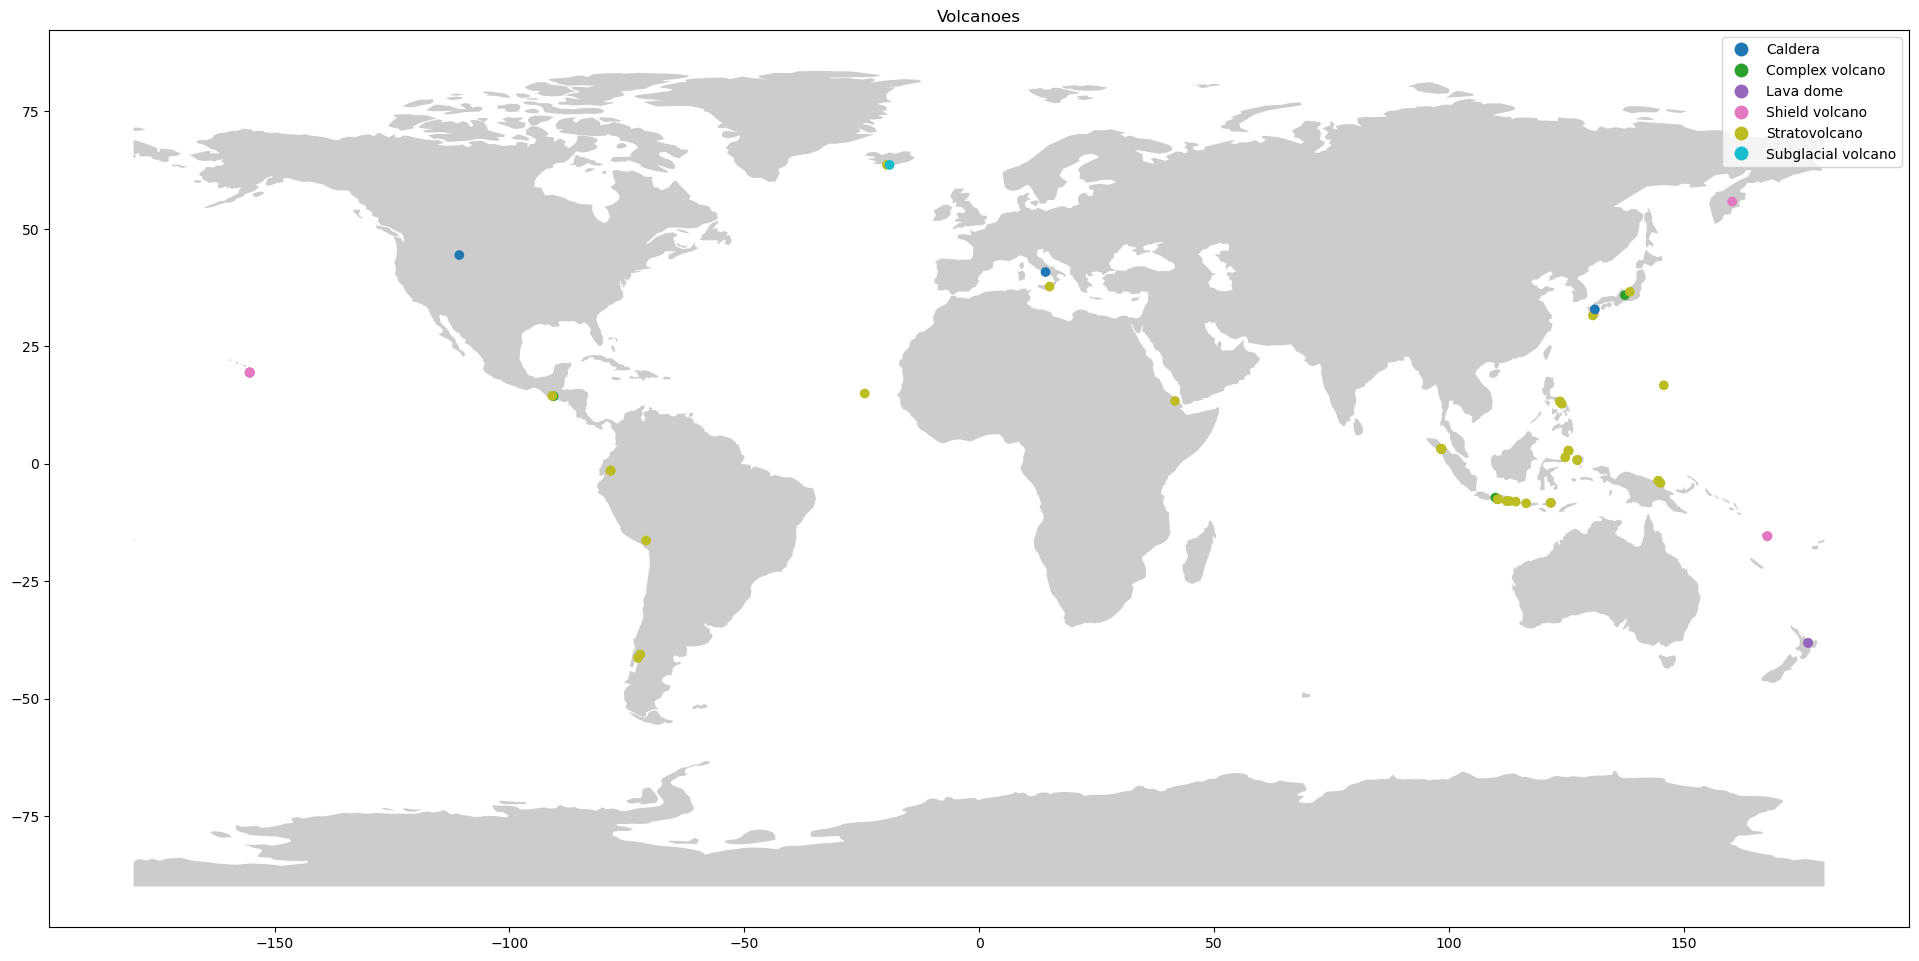
Creating a GeoDataFrame from a DataFrame with coordinates
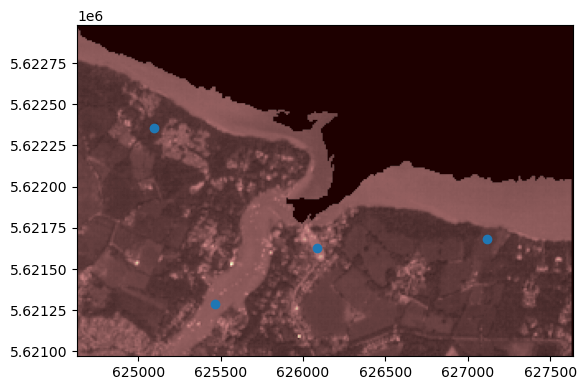
Using GeoPandas with Rasterio to sample point data
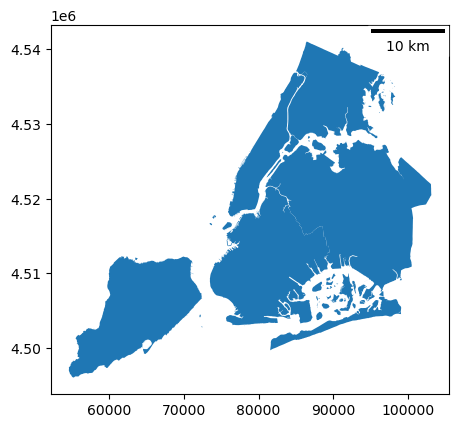
Adding a scale bar to a matplotlib plot
Overlays
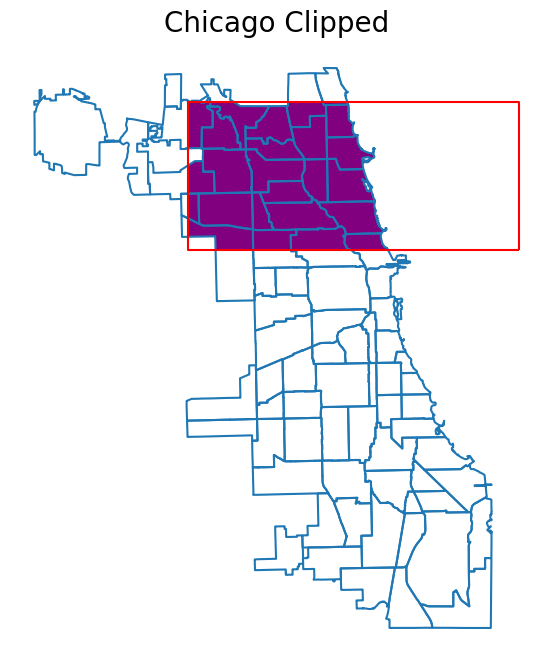
Clip Vector Data with GeoPandas
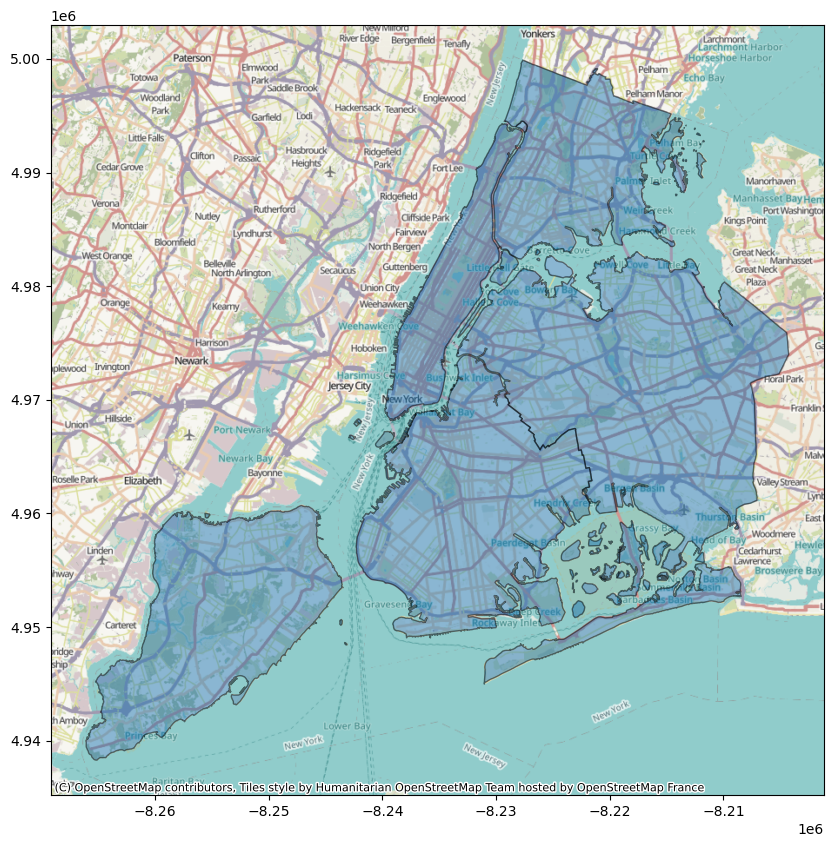
Adding a background map to plots
Plotting with Folium

Plotting with Geoplot and GeoPandas
Plotting polygons with Folium
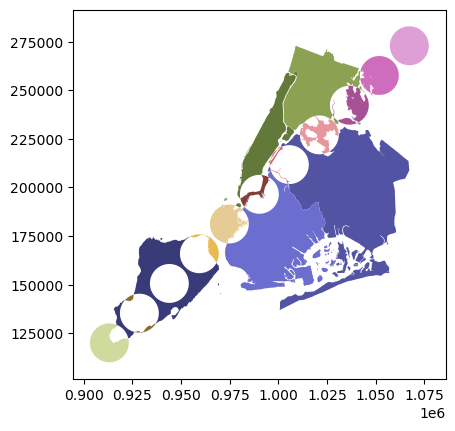
Spatial Joins