Note
Creating a GeoDataFrame from a DataFrame with coordinates#
This example shows how to create a GeoDataFrame when starting from a regular DataFrame that has coordinates either WKT (well-known text) format, or in two columns.
[1]:
import pandas as pd
import geopandas
import matplotlib.pyplot as plt
from geodatasets import get_path
/tmp/ipykernel_3279/3399634584.py:1: DeprecationWarning:
Pyarrow will become a required dependency of pandas in the next major release of pandas (pandas 3.0),
(to allow more performant data types, such as the Arrow string type, and better interoperability with other libraries)
but was not found to be installed on your system.
If this would cause problems for you,
please provide us feedback at https://github.com/pandas-dev/pandas/issues/54466

  import pandas as pd
From longitudes and latitudes#
First, let’s consider a DataFrame containing cities and their respective longitudes and latitudes.
[2]:
df = pd.DataFrame(
    {
        "City": ["Buenos Aires", "Brasilia", "Santiago", "Bogota", "Caracas"],
        "Country": ["Argentina", "Brazil", "Chile", "Colombia", "Venezuela"],
        "Latitude": [-34.58, -15.78, -33.45, 4.60, 10.48],
        "Longitude": [-58.66, -47.91, -70.66, -74.08, -66.86],
    }
)
A GeoDataFrame needs a shapely object. We use geopandas points_from_xy() to transform Longitude and Latitude into a list of shapely.Point objects and set it as a geometry while creating the GeoDataFrame. (note that points_from_xy() is an enhanced wrapper for [Point(x, y) for x, y in zip(df.Longitude, df.Latitude)]). The crs value is also set to explicitly state the geometry data defines latitude/ longitude world geodetic degree values. This is
important for the correct interpretation of the data, such as when plotting with data in other formats.
[3]:
gdf = geopandas.GeoDataFrame(
    df, geometry=geopandas.points_from_xy(df.Longitude, df.Latitude), crs="EPSG:4326"
)
gdf looks like this :
[4]:
print(gdf.head())
           City    Country  Latitude  Longitude                     geometry
0  Buenos Aires  Argentina    -34.58     -58.66  POINT (-58.66000 -34.58000)
1      Brasilia     Brazil    -15.78     -47.91  POINT (-47.91000 -15.78000)
2      Santiago      Chile    -33.45     -70.66  POINT (-70.66000 -33.45000)
3        Bogota   Colombia      4.60     -74.08    POINT (-74.08000 4.60000)
4       Caracas  Venezuela     10.48     -66.86   POINT (-66.86000 10.48000)
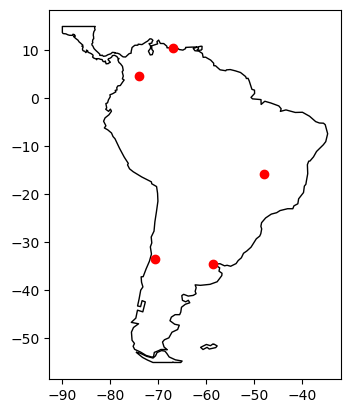
Finally, we plot the coordinates over a country-level map.
[5]:
world = geopandas.read_file(get_path("naturalearth.land"))

# We restrict to South America.
ax = world.clip([-90, -55, -25, 15]).plot(color="white", edgecolor="black")

# We can now plot our ``GeoDataFrame``.
gdf.plot(ax=ax, color="red")

plt.show()
ERROR 1: PROJ: proj_create_from_database: Open of /home/docs/checkouts/readthedocs.org/user_builds/geopandas/conda/v0.14.3/share/proj failed
From WKT format#
Here, we consider a DataFrame having coordinates in WKT format.
[6]:
df = pd.DataFrame(
    {
        "City": ["Buenos Aires", "Brasilia", "Santiago", "Bogota", "Caracas"],
        "Country": ["Argentina", "Brazil", "Chile", "Colombia", "Venezuela"],
        "Coordinates": [
            "POINT(-58.66 -34.58)",
            "POINT(-47.91 -15.78)",
            "POINT(-70.66 -33.45)",
            "POINT(-74.08 4.60)",
            "POINT(-66.86 10.48)",
        ],
    }
)
We use shapely.wkt sub-module to parse wkt format:
[7]:
from shapely import wkt

df["Coordinates"] = geopandas.GeoSeries.from_wkt(df["Coordinates"])
The GeoDataFrame is constructed as follows :
[8]:
gdf = geopandas.GeoDataFrame(df, geometry="Coordinates")

print(gdf.head())
           City    Country                  Coordinates
0  Buenos Aires  Argentina  POINT (-58.66000 -34.58000)
1      Brasilia     Brazil  POINT (-47.91000 -15.78000)
2      Santiago      Chile  POINT (-70.66000 -33.45000)
3        Bogota   Colombia    POINT (-74.08000 4.60000)
4       Caracas  Venezuela   POINT (-66.86000 10.48000)
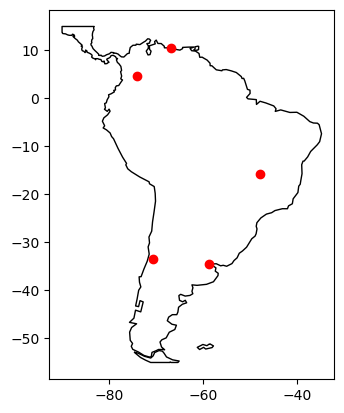
Again, we can plot our GeoDataFrame.
[9]:
ax = world.clip([-90, -55, -25, 15]).plot(color="white", edgecolor="black")

gdf.plot(ax=ax, color="red")

plt.show()