Note
Click here to download the full example code
Creating a GeoDataFrame from a DataFrame with coordinates
This example shows how to create a GeoDataFrame when starting from
a regular DataFrame that has coordinates either WKT
(well-known text)
format, or in
two columns.
import pandas as pd
import geopandas
from shapely.geometry import Point
import matplotlib.pyplot as plt
From longitudes and latitudes
First, let’s consider a DataFrame containing cities and their respective
longitudes and latitudes.
df = pd.DataFrame(
    {'City': ['Buenos Aires', 'Brasilia', 'Santiago', 'Bogota', 'Caracas'],
     'Country': ['Argentina', 'Brazil', 'Chile', 'Colombia', 'Venezuela'],
     'Latitude': [-34.58, -15.78, -33.45, 4.60, 10.48],
     'Longitude': [-58.66, -47.91, -70.66, -74.08, -66.86]})
A GeoDataFrame needs a shapely object, so we create a new column
Coordinates as a tuple of Longitude and Latitude :
df['Coordinates'] = list(zip(df.Longitude, df.Latitude))
Then, we transform tuples to Point :
df['Coordinates'] = df['Coordinates'].apply(Point)
Now, we can create the GeoDataFrame by setting geometry with the
coordinates created previously.
gdf = geopandas.GeoDataFrame(df, geometry='Coordinates')
gdf looks like this :
print(gdf.head())
Out:
City          ...                      Coordinates
0  Buenos Aires          ...            POINT (-58.66 -34.58)
1      Brasilia          ...            POINT (-47.91 -15.78)
2      Santiago          ...            POINT (-70.66 -33.45)
3        Bogota          ...               POINT (-74.08 4.6)
4       Caracas          ...             POINT (-66.86 10.48)

[5 rows x 5 columns]
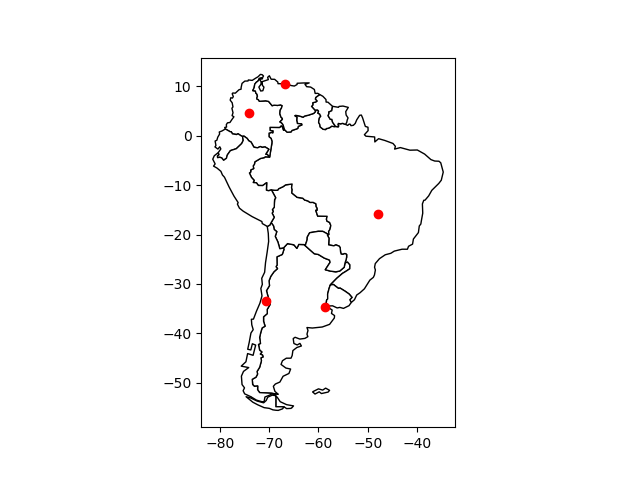
Finally, we plot the coordinates over a country-level map.
world = geopandas.read_file(geopandas.datasets.get_path('naturalearth_lowres'))

# We restrict to South America.
ax = world[world.continent == 'South America'].plot(
    color='white', edgecolor='black')

# We can now plot our GeoDataFrame.
gdf.plot(ax=ax, color='red')

plt.show()
From WKT format
Here, we consider a DataFrame having coordinates in WKT format.
df = pd.DataFrame(
    {'City': ['Buenos Aires', 'Brasilia', 'Santiago', 'Bogota', 'Caracas'],
     'Country': ['Argentina', 'Brazil', 'Chile', 'Colombia', 'Venezuela'],
     'Coordinates': ['POINT(-34.58 -58.66)', 'POINT(-15.78 -47.91)',
                     'POINT(-33.45 -70.66)', 'POINT(4.60 -74.08)',
                     'POINT(10.48 -66.86)']})
We use shapely.wkt sub-module to parse wkt format:
from shapely import wkt

df['Coordinates'] = df['Coordinates'].apply(wkt.loads)
The GeoDataFrame is constructed as follows :
gdf = geopandas.GeoDataFrame(df, geometry='Coordinates')

print(gdf.head())
Out:
City    Country            Coordinates
0  Buenos Aires  Argentina  POINT (-34.58 -58.66)
1      Brasilia     Brazil  POINT (-15.78 -47.91)
2      Santiago      Chile  POINT (-33.45 -70.66)
3        Bogota   Colombia     POINT (4.6 -74.08)
4       Caracas  Venezuela   POINT (10.48 -66.86)
Total running time of the script: ( 0 minutes 0.491 seconds)