Ctrl+K
Logo image Logo image

Site Navigation

  • Home
  • About
  • Getting started
  • Documentation
  • Community

Site Navigation

  • Home
  • About
  • Getting started
  • Documentation
  • Community

Section Navigation

Getting Started

  • Installation
  • Introduction to GeoPandas
  • Examples Gallery
    • Plotting with CartoPy and GeoPandas
    • Choro legends
    • Choropleth classification schemes from PySAL for use with GeoPandas
    • Creating a GeoDataFrame from a DataFrame with coordinates
    • Using GeoPandas with Rasterio to sample point data
    • Adding a scale bar to a matplotlib plot
    • Overlays
    • Clip Vector Data with GeoPandas
    • Adding a background map to plots
    • Plotting with Folium
    • Plotting with Geoplot and GeoPandas
    • Plotting polygons with Folium
    • Spatial Joins

Examples Gallery#

The following examples show off the functionality in GeoPandas. They highlight many of the things you can do with this package, and show off some best-practices.
thumbnail

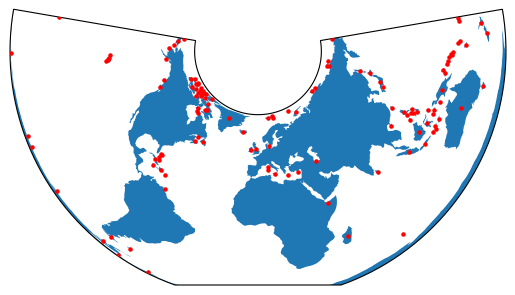
Plotting with CartoPy and GeoPandas

thumbnail

Choro legends

thumbnail

Choropleth classification schemes from PySAL for use with GeoPandas
thumbnail

Creating a GeoDataFrame from a DataFrame with coordinates
thumbnail

Using GeoPandas with Rasterio to sample point data
thumbnail

Adding a scale bar to a matplotlib plot
thumbnail

Overlays

thumbnail

Clip Vector Data with GeoPandas

thumbnail

Adding a background map to plots

thumbnail

Plotting with Folium

thumbnail

Plotting with Geoplot and GeoPandas

thumbnail

Plotting polygons with Folium

thumbnail

Spatial Joins

previous

Introduction to GeoPandas

next

Plotting with CartoPy and GeoPandas

Show Source

© Copyright 2013–2022, GeoPandas developers.

Built with the PyData Sphinx Theme 0.12.0.

Created using Sphinx 5.3.0.