Note
Plotting with Geoplot and GeoPandas#
Geoplot is a Python library providing a selection of easy-to-use geospatial visualizations. It is built on top of the lower-level CartoPy, covered in a separate section of this tutorial, and is designed to work with GeoPandas input.
This example is a brief tour of the geoplot API. For more details on the library refer to its documentation.
First we’ll load in the data using GeoPandas.
[1]:
import geopandas
import geoplot

world = geopandas.read_file(
    geopandas.datasets.get_path('naturalearth_lowres')
)
boroughs = geopandas.read_file(
    geoplot.datasets.get_path('nyc_boroughs')
)
collisions = geopandas.read_file(
    geoplot.datasets.get_path('nyc_injurious_collisions')
)
ERROR 1: PROJ: proj_create_from_database: Open of /home/docs/checkouts/readthedocs.org/user_builds/geopandas/conda/v0.12.2/share/proj failed
Plotting with Geoplot#
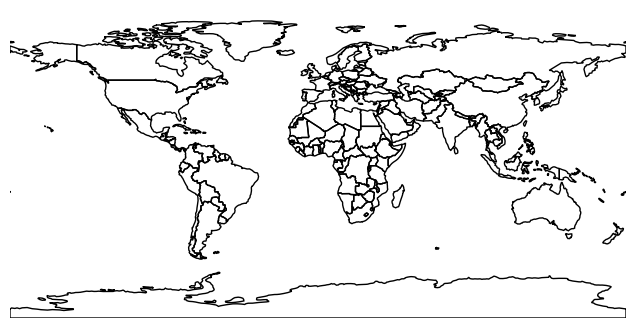
We start out by replicating the basic GeoPandas world plot using Geoplot.
[2]:
geoplot.polyplot(world, figsize=(8, 4))
/home/docs/checkouts/readthedocs.org/user_builds/geopandas/conda/v0.12.2/lib/python3.11/site-packages/geoplot/geoplot.py:885: ShapelyDeprecationWarning: Iteration over multi-part geometries is deprecated and will be removed in Shapely 2.0. Use the `geoms` property to access the constituent parts of a multi-part geometry.
  for subgeom in geom:
[2]:
<AxesSubplot: >
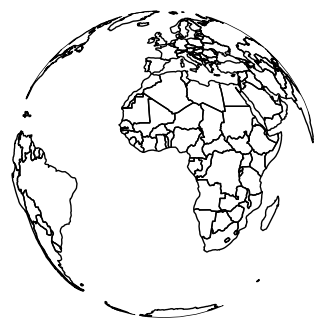
Geoplot can re-project data into any of the map projections provided by CartoPy (see the list here).
[3]:
# use the Orthographic map projection (e.g. a world globe)
ax = geoplot.polyplot(
    world, projection=geoplot.crs.Orthographic(), figsize=(8, 4)
)
ax.outline_patch.set_visible(True)
/home/docs/checkouts/readthedocs.org/user_builds/geopandas/conda/v0.12.2/lib/python3.11/site-packages/geoplot/geoplot.py:703: UserWarning: Plot extent lies outside of the Orthographic projection's viewport. Defaulting to global extent.
  warnings.warn(
---------------------------------------------------------------------------
AttributeError                            Traceback (most recent call last)
Cell In[3], line 5
      1 # use the Orthographic map projection (e.g. a world globe)
      2 ax = geoplot.polyplot(
      3     world, projection=geoplot.crs.Orthographic(), figsize=(8, 4)
      4 )
----> 5 ax.outline_patch.set_visible(True)

AttributeError: 'GeoAxesSubplot' object has no attribute 'outline_patch'
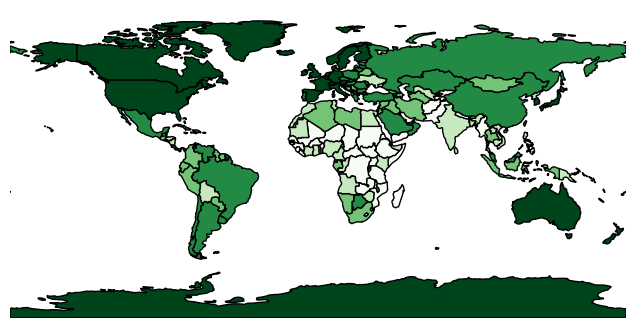
polyplot is trivial and can only plot the geometries you pass to it. If you want to use color as a visual variable, specify a choropleth. Here we sort GDP per person by country into five buckets by color, using “quantiles” binning from the Mapclassify library.
[4]:
import mapclassify
gpd_per_person = world['gdp_md_est'] / world['pop_est']
scheme = mapclassify.Quantiles(gpd_per_person, k=5)

# Note: this code sample requires geoplot>=0.4.0.
geoplot.choropleth(
    world, hue=gpd_per_person, scheme=scheme,
    cmap='Greens', figsize=(8, 4)
)
/home/docs/checkouts/readthedocs.org/user_builds/geopandas/conda/v0.12.2/lib/python3.11/site-packages/geoplot/geoplot.py:982: ShapelyDeprecationWarning: Iteration over multi-part geometries is deprecated and will be removed in Shapely 2.0. Use the `geoms` property to access the constituent parts of a multi-part geometry.
  for subgeom in geom:
[4]:
<AxesSubplot: >
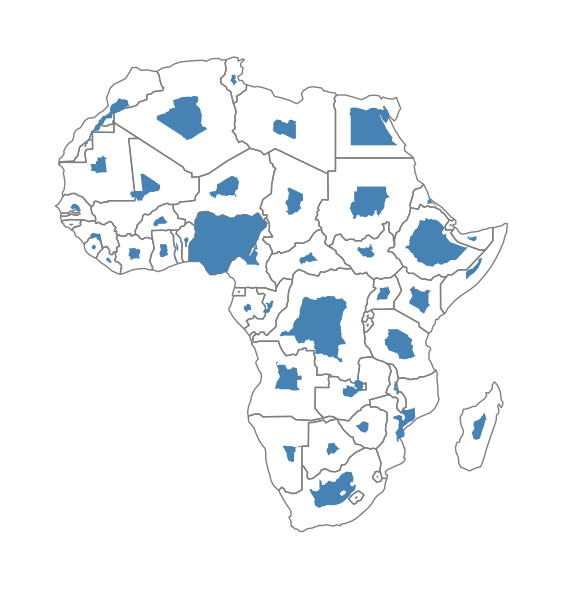
If you want to use size as a visual variable, use a cartogram. Here are population estimates for countries in Africa.
[5]:
africa = world.query('continent == "Africa"')
ax = geoplot.cartogram(
    africa, scale='pop_est', limits=(0.2, 1),
    edgecolor='None', figsize=(7, 8)
)
geoplot.polyplot(africa, edgecolor='gray', ax=ax)
/home/docs/checkouts/readthedocs.org/user_builds/geopandas/conda/v0.12.2/lib/python3.11/site-packages/geoplot/geoplot.py:1233: ShapelyDeprecationWarning: Iteration over multi-part geometries is deprecated and will be removed in Shapely 2.0. Use the `geoms` property to access the constituent parts of a multi-part geometry.
  for subgeom in scaled_polygon:
/home/docs/checkouts/readthedocs.org/user_builds/geopandas/conda/v0.12.2/lib/python3.11/site-packages/geoplot/geoplot.py:885: ShapelyDeprecationWarning: Iteration over multi-part geometries is deprecated and will be removed in Shapely 2.0. Use the `geoms` property to access the constituent parts of a multi-part geometry.
  for subgeom in geom:
[5]:
<AxesSubplot: >
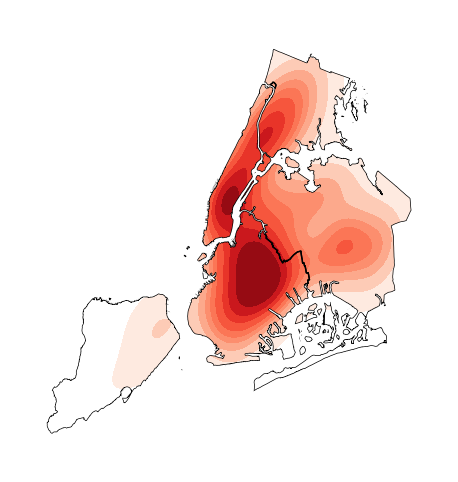
If we have data in the shape of points in space, we may generate a three-dimensional heatmap on it using kdeplot.
[6]:
ax = geoplot.kdeplot(
    collisions.head(1000), clip=boroughs.geometry,
    shade=True, cmap='Reds',
    projection=geoplot.crs.AlbersEqualArea())
geoplot.polyplot(boroughs, ax=ax, zorder=1)
/home/docs/checkouts/readthedocs.org/user_builds/geopandas/conda/v0.12.2/lib/python3.11/site-packages/geoplot/geoplot.py:1304: FutureWarning:

`shade` is now deprecated in favor of `fill`; setting `fill=True`.
This will become an error in seaborn v0.14.0; please update your code.

  sns.kdeplot(
[6]:
<GeoAxesSubplot: >
These are just some of the plots you can make with Geoplot. There are many other possibilities not covered in this brief introduction. For more examples, refer to the Gallery in the Geoplot documentation.