Geometric Manipulations
geopandas makes available all the tools for geometric manipulations in the *shapely* library.
Note that documentation for all set-theoretic tools for creating new shapes using the relationship between two different spatial datasets – like creating intersections, or differences – can be found on the set operations page.
Constructive Methods
-
GeoSeries.buffer(distance, resolution=16)¶ Returns a
GeoSeriesof geometries representing all points within a given distance of each geometric object.
-
GeoSeries.boundary¶ Returns a
GeoSeriesof lower dimensional objects representing each geometries’s set-theoretic boundary.
-
GeoSeries.centroid¶ Returns a
GeoSeriesof points for each geometric centroid.
-
GeoSeries.convex_hull¶ Returns a
GeoSeriesof geometries representing the smallest convex Polygon containing all the points in each object unless the number of points in the object is less than three. For two points, the convex hull collapses to a LineString; for 1, a Point.
-
GeoSeries.envelope¶ Returns a
GeoSeriesof geometries representing the point or smallest rectangular polygon (with sides parallel to the coordinate axes) that contains each object.
-
GeoSeries.simplify(tolerance, preserve_topology=True)¶ Returns a
GeoSeriescontaining a simplified representation of each object.
-
GeoSeries.unary_union¶ Return a geometry containing the union of all geometries in the
GeoSeries.
Affine transformations
-
GeoSeries.rotate(self, angle, origin='center', use_radians=False)¶ Rotate the coordinates of the GeoSeries.
-
GeoSeries.scale(self, xfact=1.0, yfact=1.0, zfact=1.0, origin='center')¶ Scale the geometries of the GeoSeries along each (x, y, z) dimensio.
-
GeoSeries.skew(self, angle, origin='center', use_radians=False)¶ Shear/Skew the geometries of the GeoSeries by angles along x and y dimensions.
-
GeoSeries.translate(self, angle, origin='center', use_radians=False)¶ Shift the coordinates of the GeoSeries.
Examples of Geometric Manipulations
>>> p1 = Polygon([(0, 0), (1, 0), (1, 1)])
>>> p2 = Polygon([(0, 0), (1, 0), (1, 1), (0, 1)])
>>> p3 = Polygon([(2, 0), (3, 0), (3, 1), (2, 1)])
>>> g = GeoSeries([p1, p2, p3])
>>> g
0    POLYGON ((0.0000000000000000 0.000000000000000...
1    POLYGON ((0.0000000000000000 0.000000000000000...
2    POLYGON ((2.0000000000000000 0.000000000000000...
dtype: object
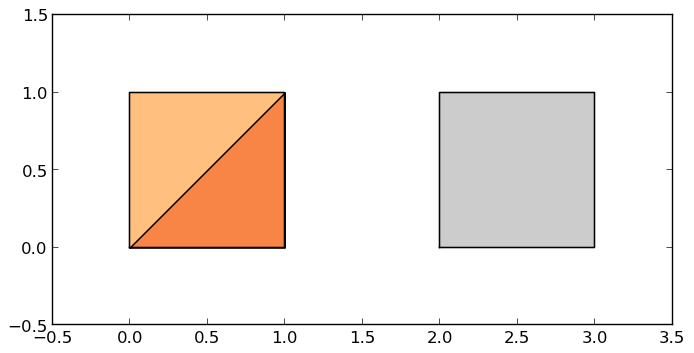
Some geographic operations return normal pandas object. The area property of a GeoSeries will return a pandas.Series containing the area of each item in the GeoSeries:
>>> print g.area
0    0.5
1    1.0
2    1.0
dtype: float64
Other operations return GeoPandas objects:
>>> g.buffer(0.5)
Out[15]:
0    POLYGON ((-0.3535533905932737 0.35355339059327...
1    POLYGON ((-0.5000000000000000 0.00000000000000...
2    POLYGON ((1.5000000000000000 0.000000000000000...
dtype: object
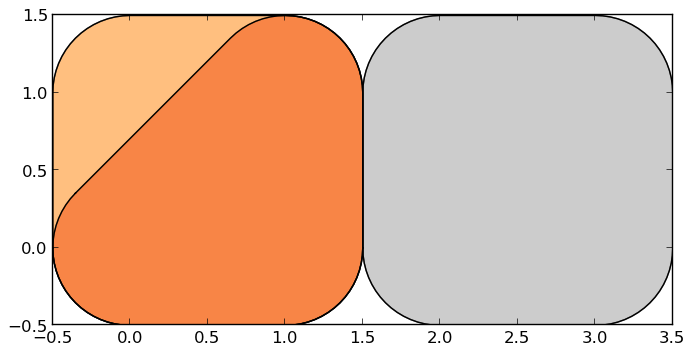
GeoPandas objects also know how to plot themselves. GeoPandas uses descartes to generate a matplotlib plot. To generate a plot of our GeoSeries, use:
>>> g.plot()
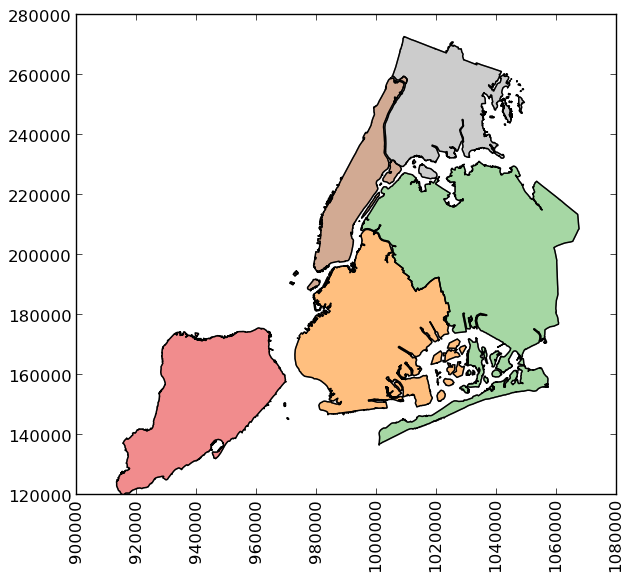
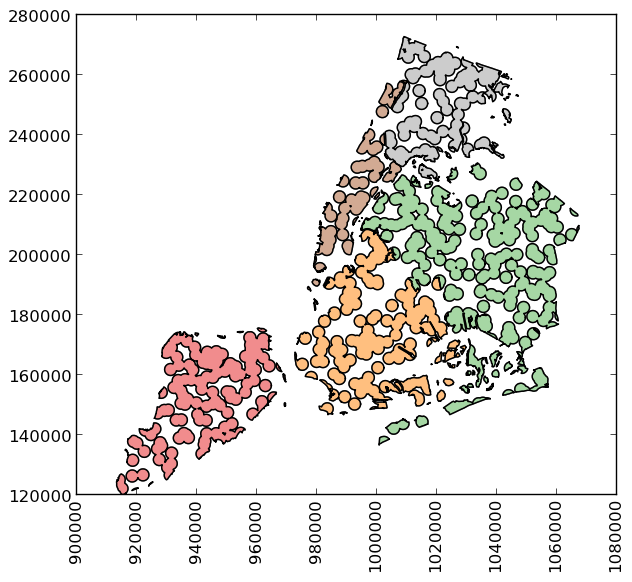
GeoPandas also implements alternate constructors that can read any data format recognized by fiona. To read a file containing the boroughs of New York City:
>>> boros = GeoDataFrame.from_file('nybb.shp')
>>> boros.set_index('BoroCode', inplace=True)
>>> boros.sort()
>>> boros
               BoroName    Shape_Area     Shape_Leng  \
BoroCode
1             Manhattan  6.364422e+08  358532.956418
2                 Bronx  1.186804e+09  464517.890553
3              Brooklyn  1.959432e+09  726568.946340
4                Queens  3.049947e+09  861038.479299
5         Staten Island  1.623853e+09  330385.036974

                                                   geometry
BoroCode
1         (POLYGON ((981219.0557861328125000 188655.3157...
2         (POLYGON ((1012821.8057861328125000 229228.264...
3         (POLYGON ((1021176.4790039062500000 151374.796...
4         (POLYGON ((1029606.0765991210937500 156073.814...
5         (POLYGON ((970217.0223999023437500 145643.3322...
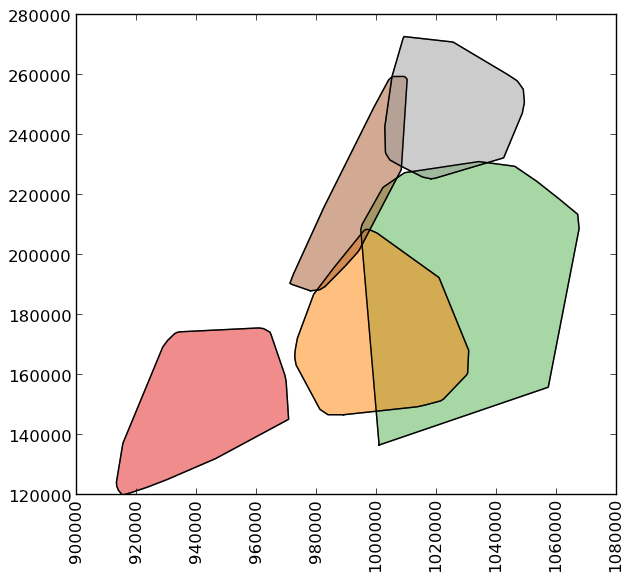
>>> boros['geometry'].convex_hull
0    POLYGON ((915517.6877458114176989 120121.88125...
1    POLYGON ((1000721.5317993164062500 136681.7761...
2    POLYGON ((988872.8212280273437500 146772.03179...
3    POLYGON ((977855.4451904296875000 188082.32238...
4    POLYGON ((1017949.9776000976562500 225426.8845...
dtype: object
To demonstrate a more complex operation, we’ll generate a
GeoSeries containing 2000 random points:
>>> from shapely.geometry import Point
>>> xmin, xmax, ymin, ymax = 900000, 1080000, 120000, 280000
>>> xc = (xmax - xmin) * np.random.random(2000) + xmin
>>> yc = (ymax - ymin) * np.random.random(2000) + ymin
>>> pts = GeoSeries([Point(x, y) for x, y in zip(xc, yc)])
Now draw a circle with fixed radius around each point:
>>> circles = pts.buffer(2000)
We can collapse these circles into a single shapely MultiPolygon geometry with
>>> mp = circles.unary_union
To extract the part of this geometry contained in each borough, we can just use:
>>> holes = boros['geometry'].intersection(mp)
and to get the area outside of the holes:
>>> boros_with_holes = boros['geometry'].difference(mp)
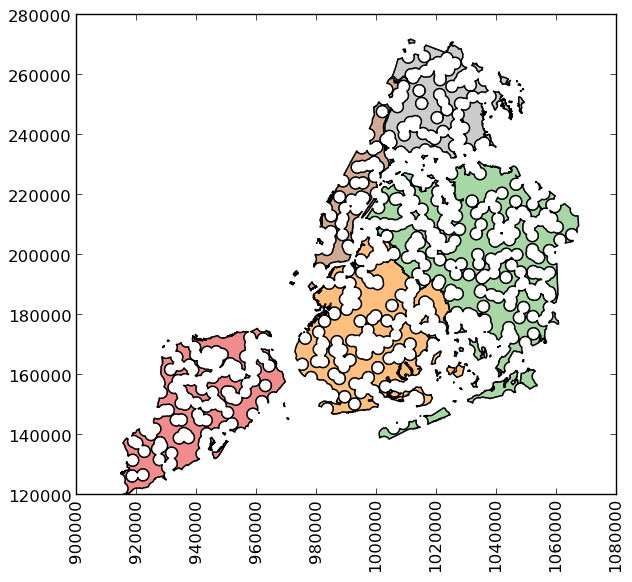
Note that this can be simplified a bit, since geometry is
available as an attribute on a GeoDataFrame, and the
intersection and difference methods are implemented with the
“&” and “-” operators, respectively. For example, the latter could
have been expressed simply as boros.geometry - mp.
It’s easy to do things like calculate the fractional area in each borough that are in the holes:
>>> holes.area / boros.geometry.area
BoroCode
1           0.602015
2           0.523457
3           0.585901
4           0.577020
5           0.559507
dtype: float64