Note
Click here to download the full example code
Adding a background map to plots
This example shows how you can add a background basemap to plots created
with the geopandas .plot() method. This makes use of the
contextily package to retrieve
web map tiles from several sources (OpenStreetMap, Stamen).
# sphinx_gallery_thumbnail_number = 3
import geopandas
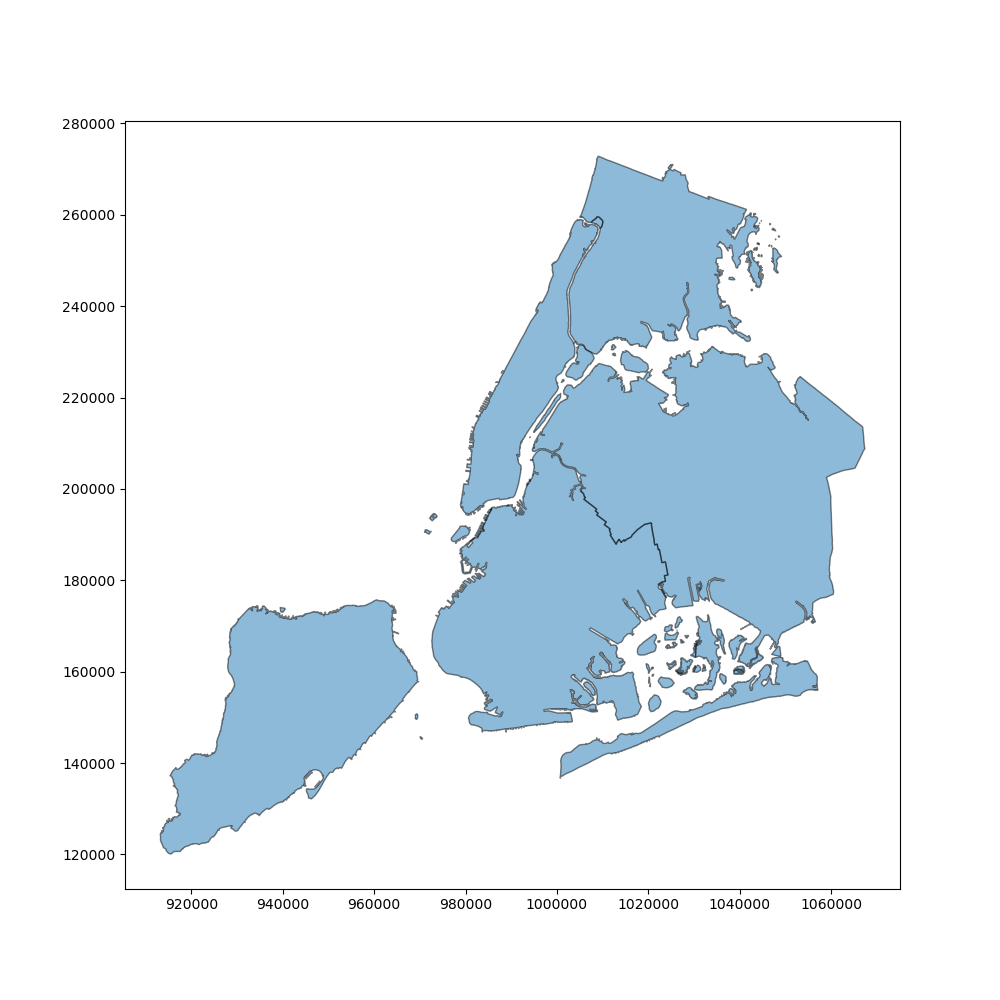
Let’s use the NYC borough boundary data that is available in geopandas datasets. Plotting this gives the following result:
df = geopandas.read_file(geopandas.datasets.get_path('nybb'))
ax = df.plot(figsize=(10, 10), alpha=0.5, edgecolor='k')
Convert the data to Web Mercator
Web map tiles are typically provided in Web Mercator (EPSG 3857), so we need to make sure to convert our data first to the same CRS to combine our polygons and background tiles in the same map:
df = df.to_crs(epsg=3857)
import contextily as ctx
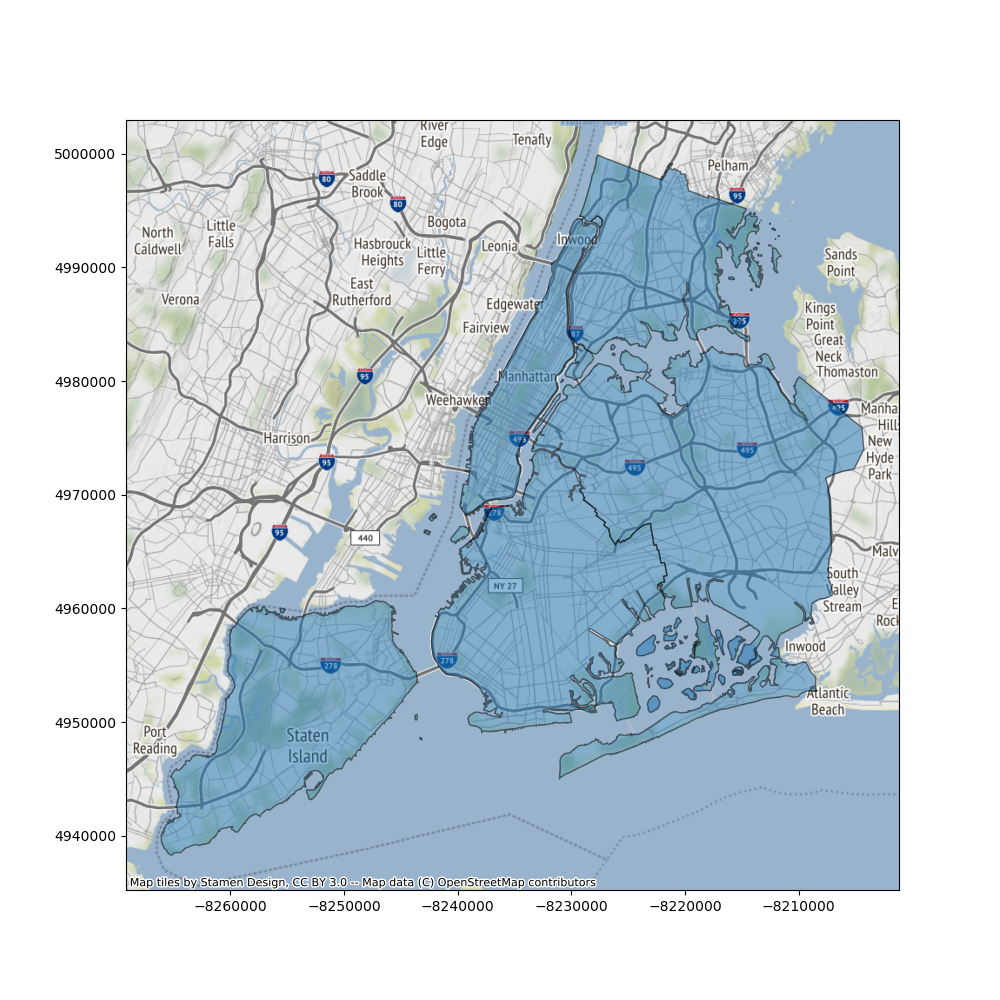
Add background tiles to plot
We can use add_basemap function of contextily to easily add a background map to our plot. :
ax = df.plot(figsize=(10, 10), alpha=0.5, edgecolor='k')
ctx.add_basemap(ax)
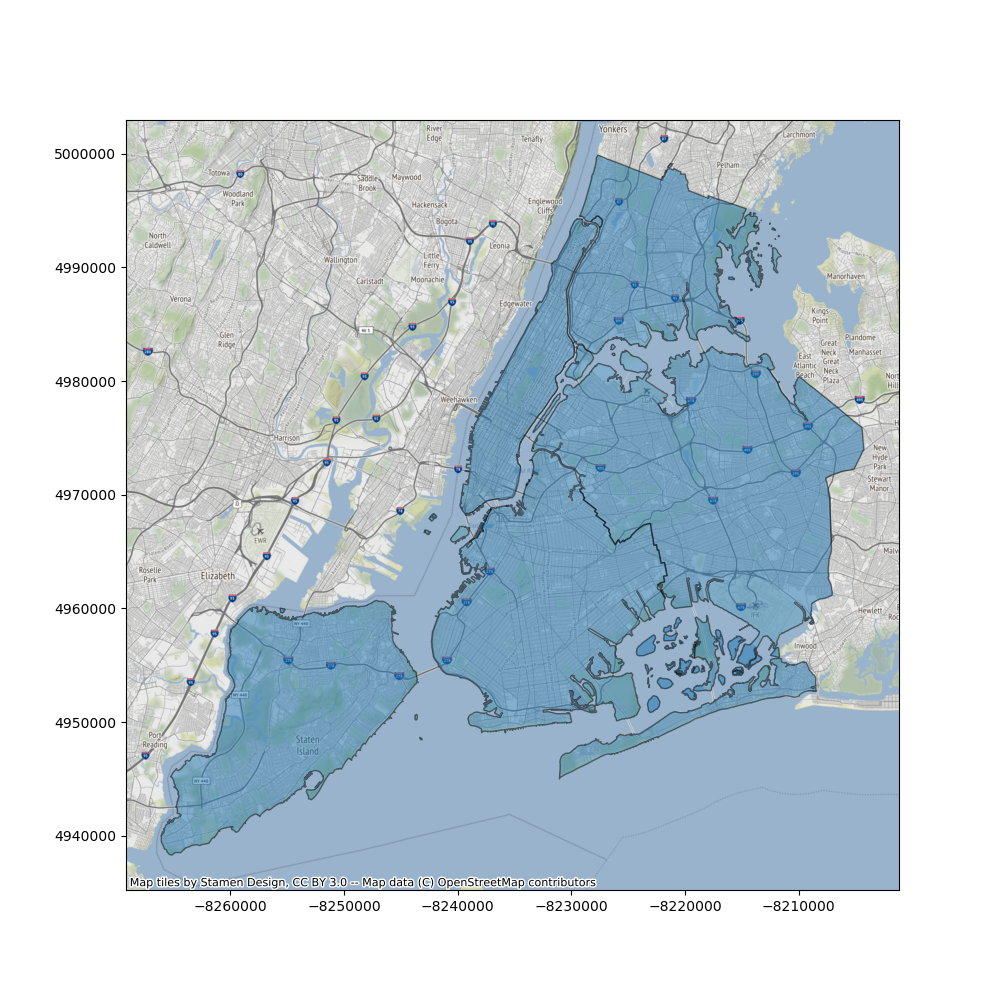
We can control the detail of the map tiles using the optional zoom keyword (be careful to not specify a too high zoom level, as this can result in a large download).:
ax = df.plot(figsize=(10, 10), alpha=0.5, edgecolor='k')
ctx.add_basemap(ax, zoom=12)
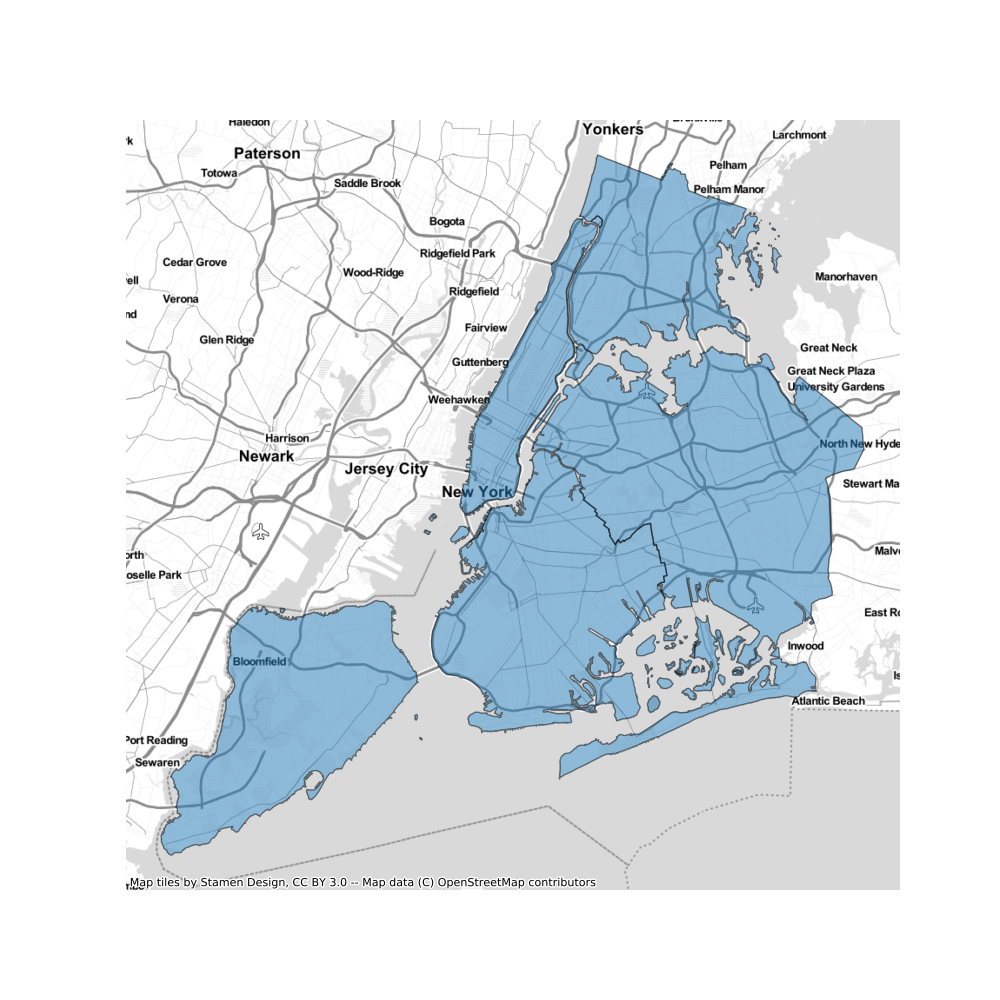
By default, contextily uses the Stamen Terrain style. We can specify a
different style using ctx.providers:
ax = df.plot(figsize=(10, 10), alpha=0.5, edgecolor='k')
ctx.add_basemap(ax, url=ctx.providers.Stamen.TonerLite)
ax.set_axis_off()
Total running time of the script: ( 0 minutes 8.359 seconds)