Note
This page was generated from gallery/choro_legends.ipynb.
Interactive online version: 
Choro legends#
[1]:
import geopandas
from geopandas import read_file
[2]:
import mapclassify

mapclassify.__version__
[2]:
'2.4.2'
[3]:
import libpysal

libpysal.__version__
[3]:
'4.4.0'
[4]:
libpysal.examples.available()
                      Name                                                  Description  Installed
0                    10740  Albuquerque, New Mexico, Census 2000 Tract Data. 10740 i...       True
1                   AirBnB         Airbnb rentals, socioeconomics, and crime in Chicago      False
2                  Atlanta                 Atlanta, GA region homicide counts and rates      False
3                Baltimore                    Baltimore house sales prices and hedonics      False
4                Bostonhsg                         Boston housing and neighborhood data      False
5              Buenosaires                Electoral Data for 1999 Argentinean Elections      False
6              Charleston1   2000 Census Tract Data for Charleston, SC MSA and counties      False
7              Charleston2   1998 and 2001 Zip Code Business Patterns (Census Bureau...      False
8           Chicago Health                             Chicago Health + Socio-Economics      False
9          Chicago commpop   Chicago Community Area Population Percent Change for 20...      False
10         Chicago parcels                           Tax parcel polygons of Cook county      False
11             Chile Labor                           Labor Markets in Chile (1982-2002)      False
12         Chile Migration                      Internal Migration in Chile (1977-2002)      False
13              Cincinnati                   2008 Cincinnati Crime + Socio-Demographics      False
14               Cleveland                 2015 sales prices of homes in Cleveland, OH.      False
15                Columbus                                  Columbus neighborhood crime      False
16               Elections                         2012 and 2016 Presidential Elections      False
17                 Grid100                                Grid with simulated variables      False
18               Groceries                                    2015 Chicago supermarkets      False
19                  Guerry                    Moral statistics of France (Guerry, 1833)      False
20       Health Indicators                          Chicago Health Indicators (2005-11)      False
21                 Health+                              2000 Health, Income + Diversity      False
22                Hickory1      2000 Census Tract Data for Hickory, NC MSA and counties      False
23                Hickory2   1998 and 2001 Zip Code Business Patterns (Census Bureau...      False
24              Home Sales                        2014-15 Home Sales in King County, WA      False
25                 Houston                 Houston, TX region homicide counts and rates      False
26                Juvenile                       Cardiff juvenile delinquent residences      False
27                Lansing1      2000 Census Tract Data for Lansing, MI MSA and counties      False
28                Lansing2   1998 and 2001 Zip Code Business Patterns (Census Bureau...      False
29                 Laozone   Ozone measures at monitoring stations in Los Angeles basin      False
30                LasRosas   Corn yield, fertilizer and field data for precision agr...      False
31                    Line                                               Line Shapefile       True
32           Liquor Stores                                   2015 Chicago Liquor Stores      False
33                 Malaria   Malaria incidence and population (1973, 95, 93 censuses...      False
34              Milwaukee1                 2000 Census Tract Data for Milwaukee, WI MSA      False
35              Milwaukee2   1998 and 2001 Zip Code Business Patterns (Census Bureau...      False
36                   NCOVR                                US county homicides 1960-1990       True
37                    NDVI                  Normalized Difference Vegetation Index grid      False
38                     NYC   Demographic and housing data for New York City subborou...      False
39            NYC Earnings                        Block-level Earnings in NYC (2002-14)      False
40           NYC Education                                         NYC Education (2000)      False
41       NYC Neighborhoods                 Demographics for New York City neighborhoods      False
42  NYC Socio-Demographics                           NYC Education + Socio-Demographics      False
43              Natregimes                              NCOVR with regimes (book/PySAL)      False
44                   Nepal   Health, poverty and education indicators for Nepal dist...      False
45                Ohiolung                      Ohio lung cancer data, 1968, 1978, 1988      False
46                Orlando1      2000 Census Tract Data for Orlando, FL MSA and counties      False
47                Orlando2   1998 and 2001 Zip Code Business Patterns (Census Bureau...      False
48                  Oz9799                                  Monthly ozone data, 1997-99      False
49             Phoenix ACS   Phoenix American Community Survey Data (2010, 5-year av...      False
50              Pittsburgh                                Pittsburgh homicide locations      False
51                   Point                                              Point Shapefile       True
52                  Police                     Police expenditures Mississippi counties      False
53                 Polygon                                            Polygon Shapefile       True
54           Polygon_Holes                           Example to test treatment of holes       True
55       Rio Grande do Sul           Cities of the Brazilian State of Rio Grande do Sul       True
56                    SIDS                      North Carolina county SIDS death counts      False
57                   SIDS2            North Carolina county SIDS death counts and rates      False
58             Sacramento1                    2000 Census Tract Data for Sacramento MSA       True
59             Sacramento2   1998 and 2001 Zip Code Business Patterns (Census Bureau...       True
60           SanFran Crime   July-Dec 2012 crime incidents in San Francisco (points ...      False
61               Savannah1     2000 Census Tract Data for Savannah, GA MSA and counties      False
62               Savannah2   1998 and 2001 Zip Code Business Patterns (Census Bureau...      False
63                 Scotlip                         Male lip cancer in Scotland, 1975-80      False
64                Seattle1      2000 Census Tract Data for Seattle, WA MSA and counties      False
65                Seattle2   1998 and 2001 Zip Code Business Patterns (Census Bureau...      False
66                    Snow                John Snow & the 19th Century Cholera Epidemic      False
67                   South                       US Southern county homicides 1960-1990       True
68                 Spirals                                      Synthetic spiral points      False
69                 StLouis             St Louis region county homicide counts and rates      False
70                  Tampa1        2000 Census Tract Data for Tampa, FL MSA and counties      False
71                 US SDOH                   2014 US Social Determinants of Health Data      False
72                  arcgis                                         arcgis testing files       True
73                  baltim             Baltimore house sales prices and hedonics, 1978.       True
74                  berlin         Prenzlauer Berg neighborhood AirBnB data from Berlin       True
75                    book                 Synthetic data to illustrate spatial weights       True
76                 burkitt    Burkitt's lymphoma in the Western Nile district of Uganda       True
77                  calemp                   Employment density for California counties       True
78                 chicago                                        Chicago neighborhoods       True
79              clearwater                                         mgwr testing dataset      False
80                columbus                        Columbus neighborhood crime data 1980       True
81                 desmith              Small dataset to illustrate Moran's I statistic       True
82                geodanet                  Datasets from GeoDaNet for network analysis       True
83                 georgia  Various socio-economic variables for counties within the...       True
84                juvenile              Residences of juvenile offenders in Cardiff, UK       True
85                  mexico     Decennial per capita incomes of Mexican states 1940-2000       True
86                networks                            Datasets used for network testing       True
87                newHaven                                      Network testing dataset      False
88               nyc_bikes                                     New York City Bike Trips      False
89                   sids2            North Carolina county SIDS death counts and rates       True
90               snow_maps  Public water pumps and Cholera deaths in London 1854 (Jo...       True
91                     stl  Homicides and selected socio-economic characteristics fo...       True
92          street_net_pts                                        Street network points       True
93                     taz                     Traffic Analysis Zones in So. California      False
94                   tokyo                                         Tokyo Mortality data       True
95               us_income       Per-capita income for the lower 48 US states 1929-2009       True
96                virginia                                  Virginia counties shapefile       True
97                    wmat                    Datasets used for spatial weights testing       True
[5]:
_ = libpysal.examples.load_example("South")
pth = libpysal.examples.get_path("south.shp")
[6]:
df = read_file(pth)
Default legend formatting#
[7]:
%matplotlib inline
ax = df.plot(
    column="HR60",
    scheme="QUANTILES",
    k=4,
    cmap="BuPu",
    legend=True,
    legend_kwds={"loc": "center left", "bbox_to_anchor": (1, 0.5)},
)
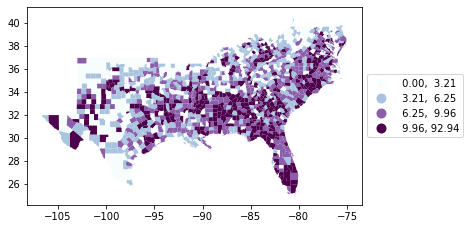
[8]:
labels = [t.get_text() for t in ax.get_legend().get_texts()]
labels
[8]:
[' 0.00, 3.21', ' 3.21, 6.25', ' 6.25, 9.96', ' 9.96, 92.94']
[9]:
q4 = mapclassify.Quantiles(df.HR60, k=4)
q4
[9]:
Quantiles

   Interval      Count
----------------------
[ 0.00,  3.21] |   353
( 3.21,  6.25] |   353
( 6.25,  9.96] |   353
( 9.96, 92.94] |   353
[10]:
labels == q4.get_legend_classes()
[10]:
False
Note that in this case, the first interval is closed on the minimum value in the dataset. The other intervals have an open lower bound. This can be now displayed in the legend using legend_kwds={'interval': True}.
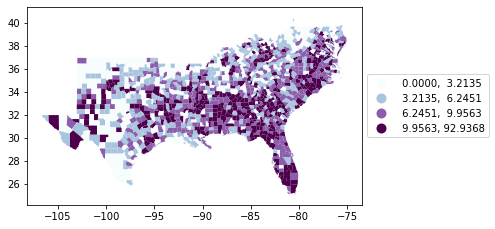
Overriding numerical format#
[11]:
ax = df.plot(
    column="HR60",
    scheme="QUANTILES",
    k=4,
    cmap="BuPu",
    legend=True,
    legend_kwds={"loc": "center left", "bbox_to_anchor": (1, 0.5)},
)

[12]:
ax = df.plot(
    column="HR60",
    scheme="QUANTILES",
    k=4,
    cmap="BuPu",
    legend=True,
    legend_kwds={"loc": "center left", "bbox_to_anchor": (1, 0.5), "fmt": "{:.4f}"},
)
[13]:
ax = df.plot(
    column="HR60",
    scheme="QUANTILES",
    k=4,
    cmap="BuPu",
    legend=True,
    legend_kwds={"loc": "center left", "bbox_to_anchor": (1, 0.5), "fmt": "{:.0f}"},
)
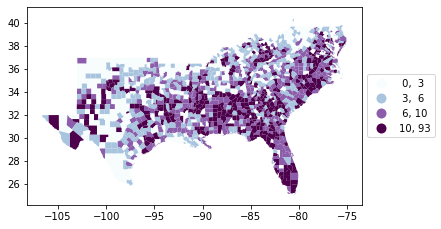
The new legends_kwds arg fmt takes a string to set the numerical formatting.
When first class lower bound < y.min()#
[14]:
ax = df.plot(
    column="HR60",
    scheme="BoxPlot",
    cmap="BuPu",
    legend=True,
    legend_kwds={"loc": "center left", "bbox_to_anchor": (1, 0.5), "fmt": "{:.0f}"},
)
[15]:
bp = mapclassify.BoxPlot(df.HR60)
bp
[15]:
BoxPlot

   Interval      Count
----------------------
( -inf, -6.90] |     0
(-6.90,  3.21] |   353
( 3.21,  6.25] |   353
( 6.25,  9.96] |   353
( 9.96, 20.07] |   311
(20.07, 92.94] |    42
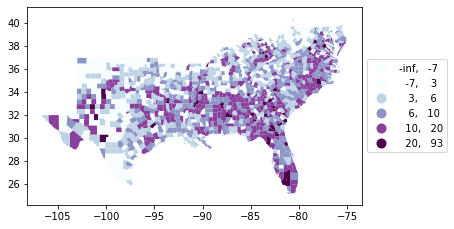
[16]:
bp.get_legend_classes(fmt="{:.0f}")
[16]:
['(-inf,   -7]',
 '(  -7,    3]',
 '(   3,    6]',
 '(   6,   10]',
 '(  10,   20]',
 '(  20,   93]']
In some classifiers the user should be aware that the lower (upper) bound of the first (last) interval is not equal to the minimum (maximum) of the attribute values. This is useful to detect extreme values and highly skewed distributions.
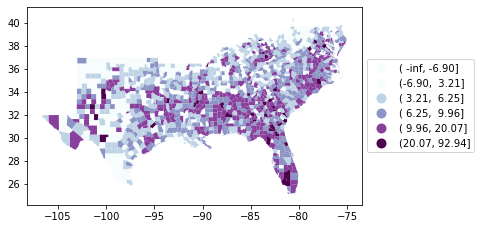
Show interval bracket#
[17]:
ax = df.plot(
    column="HR60",
    scheme="BoxPlot",
    cmap="BuPu",
    legend=True,
    legend_kwds={"loc": "center left", "bbox_to_anchor": (1, 0.5), "interval": True},
)
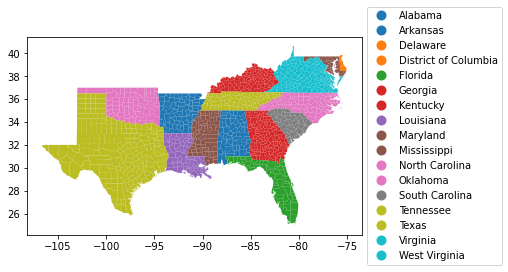
Categorical Data#
[18]:
ax = df.plot(
    column="STATE_NAME",
    categorical=True,
    legend=True,
    legend_kwds={"loc": "center left", "bbox_to_anchor": (1, 0.5), "fmt": "{:.0f}"},
)  # fmt is ignored for categorical data