Note
Creating a GeoDataFrame from a DataFrame with coordinates#
This example shows how to create a GeoDataFrame when starting from a regular DataFrame that has coordinates either WKT (well-known text) format, or in two columns.
[1]:
import pandas as pd
import geopandas
import matplotlib.pyplot as plt
from geodatasets import get_path
From longitudes and latitudes#
First, let’s consider a DataFrame containing cities and their respective longitudes and latitudes.
[2]:
df = pd.DataFrame(
    {
        "City": ["Buenos Aires", "Brasilia", "Santiago", "Bogota", "Caracas"],
        "Country": ["Argentina", "Brazil", "Chile", "Colombia", "Venezuela"],
        "Latitude": [-34.58, -15.78, -33.45, 4.60, 10.48],
        "Longitude": [-58.66, -47.91, -70.66, -74.08, -66.86],
    }
)
A GeoDataFrame needs a shapely object. We use geopandas points_from_xy() to transform Longitude and Latitude into a list of shapely.Point objects and set it as a geometry while creating the GeoDataFrame. (note that points_from_xy() is an enhanced wrapper for [Point(x, y) for x, y in zip(df.Longitude, df.Latitude)]). The crs value is also set to explicitly state the geometry data defines latitude/ longitude world geodetic degree values. This is
important for the correct interpretation of the data, such as when plotting with data in other formats.
[3]:
gdf = geopandas.GeoDataFrame(
    df, geometry=geopandas.points_from_xy(df.Longitude, df.Latitude), crs="EPSG:4326"
)
gdf looks like this :
[4]:
print(gdf.head())
           City    Country  Latitude  Longitude               geometry
0  Buenos Aires  Argentina    -34.58     -58.66  POINT (-58.66 -34.58)
1      Brasilia     Brazil    -15.78     -47.91  POINT (-47.91 -15.78)
2      Santiago      Chile    -33.45     -70.66  POINT (-70.66 -33.45)
3        Bogota   Colombia      4.60     -74.08     POINT (-74.08 4.6)
4       Caracas  Venezuela     10.48     -66.86   POINT (-66.86 10.48)
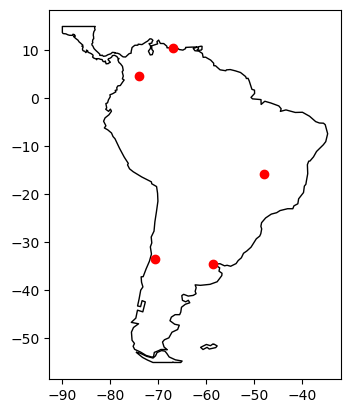
Finally, we plot the coordinates over a country-level map.
[5]:
world = geopandas.read_file(get_path("naturalearth.land"))

# We restrict to South America.
ax = world.clip([-90, -55, -25, 15]).plot(color="white", edgecolor="black")

# We can now plot our ``GeoDataFrame``.
gdf.plot(ax=ax, color="red")

plt.show()

From WKT format#
Here, we consider a DataFrame having coordinates in WKT format.
[6]:
df = pd.DataFrame(
    {
        "City": ["Buenos Aires", "Brasilia", "Santiago", "Bogota", "Caracas"],
        "Country": ["Argentina", "Brazil", "Chile", "Colombia", "Venezuela"],
        "Coordinates": [
            "POINT(-58.66 -34.58)",
            "POINT(-47.91 -15.78)",
            "POINT(-70.66 -33.45)",
            "POINT(-74.08 4.60)",
            "POINT(-66.86 10.48)",
        ],
    }
)
We use shapely.wkt sub-module to parse wkt format:
[7]:
from shapely import wkt

df["Coordinates"] = geopandas.GeoSeries.from_wkt(df["Coordinates"])
The GeoDataFrame is constructed as follows :
[8]:
gdf = geopandas.GeoDataFrame(df, geometry="Coordinates")

print(gdf.head())
           City    Country            Coordinates
0  Buenos Aires  Argentina  POINT (-58.66 -34.58)
1      Brasilia     Brazil  POINT (-47.91 -15.78)
2      Santiago      Chile  POINT (-70.66 -33.45)
3        Bogota   Colombia     POINT (-74.08 4.6)
4       Caracas  Venezuela   POINT (-66.86 10.48)
Again, we can plot our GeoDataFrame.
[9]:
ax = world.clip([-90, -55, -25, 15]).plot(color="white", edgecolor="black")

gdf.plot(ax=ax, color="red")

plt.show()