Aggregation with dissolve#
Spatial data are often more granular than we need. For example, we might have data on sub-national units, but we’re actually interested in studying patterns at the level of countries.
In a non-spatial setting, when all we need are summary statistics of the data, we aggregate our data using the groupby() function. But for spatial data, we sometimes also need to aggregate geometric features. In the geopandas library, we can aggregate geometric features using the dissolve() function.
dissolve() can be thought of as doing three things:
it dissolves all the geometries within a given group together into a single geometric feature (using the
unary_unionmethod), andit aggregates all the rows of data in a group using groupby.aggregate, and
it combines those two results.
dissolve() Example#
Suppose we are interested in studying continents, but we only have country-level data like the country dataset included in geopandas. We can easily convert this to a continent-level dataset.
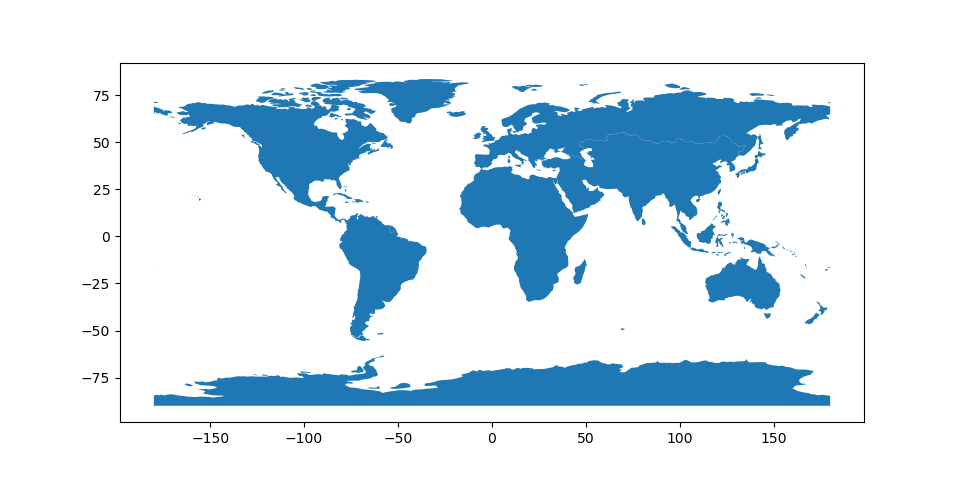
First, let’s look at the most simple case where we just want continent shapes and names. By default, dissolve() will pass 'first' to groupby.aggregate.
In [1]: world = geopandas.read_file(geopandas.datasets.get_path('naturalearth_lowres'))

In [2]: world = world[['continent', 'geometry']]

In [3]: continents = world.dissolve(by='continent')

In [4]: continents.plot();

In [5]: continents.head()
Out[5]:
                                                        geometry
continent
Africa         MULTIPOLYGON (((-11.43878 6.78592, -11.70819 6...
Antarctica     MULTIPOLYGON (((-61.13898 -79.98137, -60.61012...
Asia           MULTIPOLYGON (((48.67923 14.00320, 48.23895 13...
Europe         MULTIPOLYGON (((-53.55484 2.33490, -53.77852 2...
North America  MULTIPOLYGON (((-155.22217 19.23972, -155.5421...
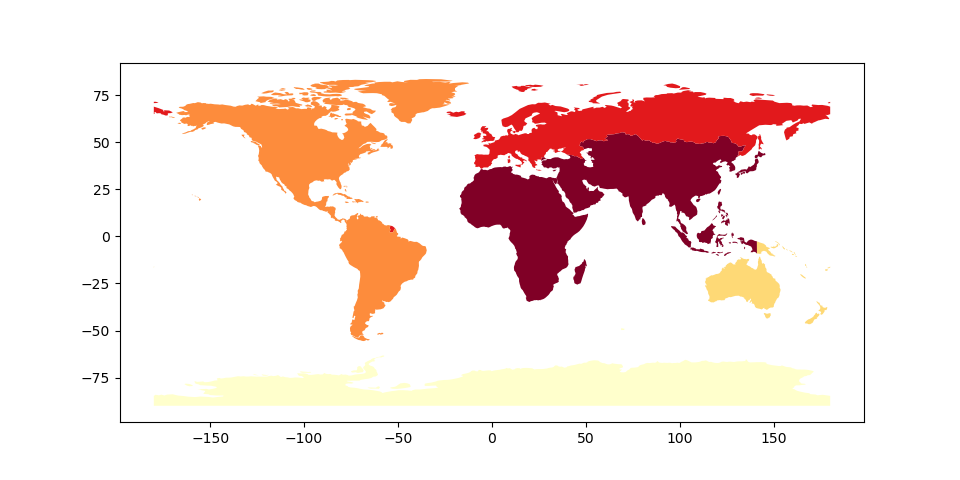
If we are interested in aggregate populations, however, we can pass different functions to the dissolve() method to aggregate populations using the aggfunc = argument:
In [6]: world = geopandas.read_file(geopandas.datasets.get_path('naturalearth_lowres'))

In [7]: world = world[['continent', 'geometry', 'pop_est']]

In [8]: continents = world.dissolve(by='continent', aggfunc='sum')

In [9]: continents.plot(column = 'pop_est', scheme='quantiles', cmap='YlOrRd');

In [10]: continents.head()
Out[10]:
                                                        geometry       pop_est
continent
Africa         MULTIPOLYGON (((-11.43878 6.78592, -11.70819 6...  1.306370e+09
Antarctica     MULTIPOLYGON (((-61.13898 -79.98137, -60.61012...  4.490000e+03
Asia           MULTIPOLYGON (((48.67923 14.00320, 48.23895 13...  4.550277e+09
Europe         MULTIPOLYGON (((-53.55484 2.33490, -53.77852 2...  7.454125e+08
North America  MULTIPOLYGON (((-155.22217 19.23972, -155.5421...  5.837560e+08
Dissolve Arguments#
The aggfunc = argument defaults to ‘first’ which means that the first row of attributes values found in the dissolve routine will be assigned to the resultant dissolved geodataframe.
However it also accepts other summary statistic options as allowed by pandas.groupby including:
‘first’
‘last’
‘min’
‘max’
‘sum’
‘mean’
‘median’
function
string function name
list of functions and/or function names, e.g. [np.sum, ‘mean’]
dict of axis labels -> functions, function names or list of such.
For example, to get the number of countries on each continent,
as well as the populations of the largest and smallest country of each,
we can aggregate the 'name' column using 'count',
and the 'pop_est' column using 'min' and 'max':
In [11]: world = geopandas.read_file(geopandas.datasets.get_path("naturalearth_lowres"))

In [12]: continents = world.dissolve(
   ....:      by="continent",
   ....:      aggfunc={
   ....:          "name": "count",
   ....:          "pop_est": ["min", "max"],
   ....:      },
   ....:  )
   ....: continents.head()
   ....:
Out[12]:
                                                        geometry  ...  (pop_est, max)
continent                                                         ...
Africa         MULTIPOLYGON (((-11.43878 6.78592, -11.70819 6...  ...    2.009636e+08
Antarctica     MULTIPOLYGON (((-61.13898 -79.98137, -60.61012...  ...    4.490000e+03
Asia           MULTIPOLYGON (((48.67923 14.00320, 48.23895 13...  ...    1.397715e+09
Europe         MULTIPOLYGON (((-53.55484 2.33490, -53.77852 2...  ...    1.443735e+08
North America  MULTIPOLYGON (((-155.22217 19.23972, -155.5421...  ...    3.282395e+08

[5 rows x 4 columns]