Data Structures#
GeoPandas implements two main data structures, a GeoSeries and a
GeoDataFrame. These are subclasses of pandas.Series and
pandas.DataFrame, respectively.
GeoSeries#
A GeoSeries is essentially a vector where each entry in the vector
is a set of shapes corresponding to one observation. An entry may consist
of only one shape (like a single polygon) or multiple shapes that are
meant to be thought of as one observation (like the many polygons that
make up the State of Hawaii or a country like Indonesia).
geopandas has three basic classes of geometric objects (which are actually shapely objects):
Points / Multi-Points
Lines / Multi-Lines
Polygons / Multi-Polygons
Note that all entries in a GeoSeries need not be of the same geometric type, although certain export operations will fail if this is not the case.
Overview of Attributes and Methods#
The GeoSeries class implements nearly all of the attributes and
methods of Shapely objects. When applied to a GeoSeries, they
will apply elementwise to all geometries in the series. Binary
operations can be applied between two GeoSeries, in which case the
operation is carried out elementwise. The two series will be aligned
by matching indices. Binary operations can also be applied to a
single geometry, in which case the operation is carried out for each
element of the series with that geometry. In either case, a
Series or a GeoSeries will be returned, as appropriate.
A short summary of a few attributes and methods for GeoSeries is presented here, and a full list can be found in the all attributes and methods page. There is also a family of methods for creating new shapes by expanding existing shapes or applying set-theoretic operations like “union” described in geometric manipulations.
Attributes#
area: shape area (units of projection – see projections)bounds: tuple of max and min coordinates on each axis for each shapetotal_bounds: tuple of max and min coordinates on each axis for entire GeoSeriesgeom_type: type of geometry.is_valid: tests if coordinates make a shape that is reasonable geometric shape (according to this).
Basic Methods#
distance(): returnsSerieswith minimum distance from each entry tootherrepresentative_point(): returnsGeoSeriesof points that are guaranteed to be within each geometry. It does NOT return centroids.to_crs(): change coordinate reference system. See projections
Relationship Tests#
geom_almost_equals(): is shape almost the same asother(good when floating point precision issues make shapes slightly different)contains(): is shape contained withinotherintersects(): does shape intersectother
GeoDataFrame#
A GeoDataFrame is a tabular data structure that contains a GeoSeries.
The most important property of a GeoDataFrame is that it always has one GeoSeries column that holds a special status. This GeoSeries is referred to as the GeoDataFrame’s “geometry”. When a spatial method is applied to a GeoDataFrame (or a spatial attribute like area is called), this commands will always act on the “geometry” column.
The “geometry” column – no matter its name – can be accessed through the geometry attribute (gdf.geometry), and the name of the geometry column can be found by typing gdf.geometry.name.
A GeoDataFrame may also contain other columns with geometrical (shapely) objects, but only one column can be the active geometry at a time. To change which column is the active geometry column, use the GeoDataFrame.set_geometry() method.
An example using the worlds GeoDataFrame:
In [1]: world = geopandas.read_file(geopandas.datasets.get_path('naturalearth_lowres'))

In [2]: world.head()
Out[2]:
       pop_est  ...                                           geometry
0     889953.0  ...  MULTIPOLYGON (((180.00000 -16.06713, 180.00000...
1   58005463.0  ...  POLYGON ((33.90371 -0.95000, 34.07262 -1.05982...
2     603253.0  ...  POLYGON ((-8.66559 27.65643, -8.66512 27.58948...
3   37589262.0  ...  MULTIPOLYGON (((-122.84000 49.00000, -122.9742...
4  328239523.0  ...  MULTIPOLYGON (((-122.84000 49.00000, -120.0000...

[5 rows x 6 columns]

#Plot countries
In [3]: world.plot();
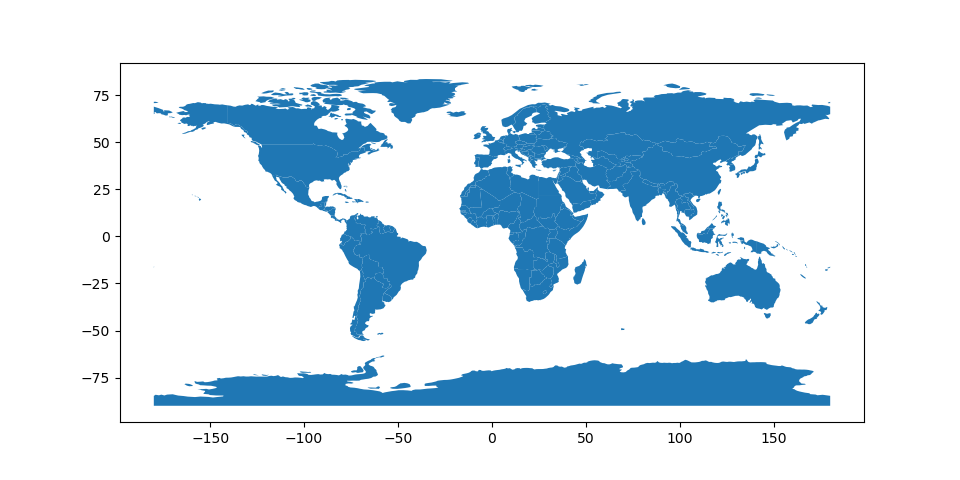
Currently, the column named “geometry” with country borders is the active geometry column:
In [4]: world.geometry.name
Out[4]: 'geometry'
We can also rename this column to “borders”:
In [5]: world = world.rename(columns={'geometry': 'borders'}).set_geometry('borders')

In [6]: world.geometry.name
Out[6]: 'borders'
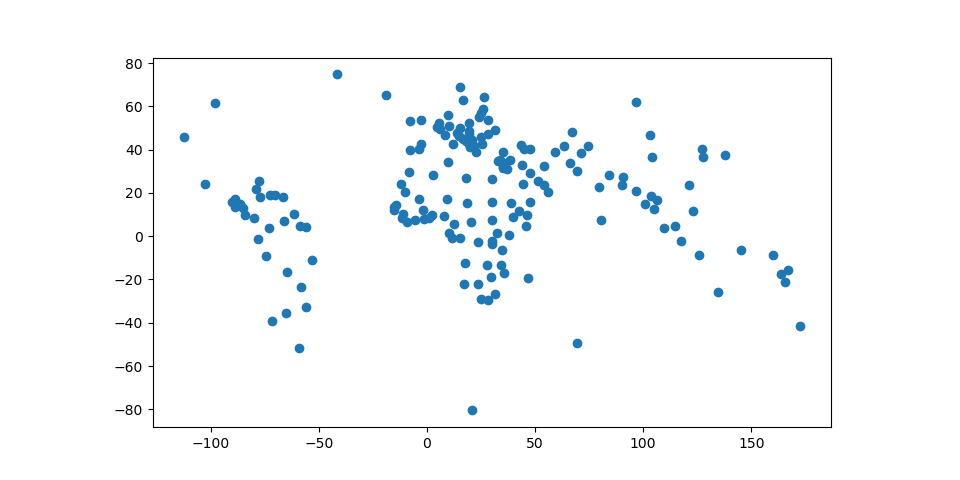
Now, we create centroids and make it the geometry:
In [7]: world['centroid_column'] = world.centroid

In [8]: world = world.set_geometry('centroid_column')

In [9]: world.plot();
Note: A GeoDataFrame keeps track of the active column by name, so if you rename the active geometry column, you must also reset the geometry:
gdf = gdf.rename(columns={'old_name': 'new_name'}).set_geometry('new_name')
Note 2: Somewhat confusingly, by default when you use the read_file() command, the column containing spatial objects from the file is named “geometry” by default, and will be set as the active geometry column. However, despite using the same term for the name of the column and the name of the special attribute that keeps track of the active column, they are distinct. You can easily shift the active geometry column to a different GeoSeries with the set_geometry() command. Further, gdf.geometry will always return the active geometry column, not the column named geometry. If you wish to call a column named “geometry”, and a different column is the active geometry column, use gdf['geometry'], not gdf.geometry.
Attributes and Methods#
Any of the attributes calls or methods described for a GeoSeries will work on a GeoDataFrame – effectively, they are just applied to the “geometry” GeoSeries.
However, GeoDataFrames also have a few extra methods for input and output which are described on the Input and Output page and for geocoding with are described in Geocoding.
Display options#
GeoPandas has an options attribute with currently a single configuration
option to control:
In [10]: import geopandas

In [11]: geopandas.options
Out[11]:
Options(
  display_precision: None [default: None]
      The precision (maximum number of decimals) of the coordinates in the
      WKT representation in the Series/DataFrame display. By default (None),
      it tries to infer and use 3 decimals for projected coordinates and 5
      decimals for geographic coordinates.
  use_pygeos: True [default: True]
      Whether to use PyGEOS to speed up spatial operations. The default is
      True if PyGEOS is installed, and follows the USE_PYGEOS environment
      variable if set.
  )
The geopandas.options.display_precision option can control the number of
decimals to show in the display of coordinates in the geometry column.
In the world example of above, the default is to show 5 decimals for
geographic coordinates:
In [12]: world['centroid_column'].head()
Out[12]:
0    POINT (163.85316 -17.31631)
1      POINT (34.75299 -6.25773)
2     POINT (-12.13783 24.29117)
3     POINT (-98.14238 61.46908)
4    POINT (-112.59944 45.70563)
Name: centroid_column, dtype: geometry
If you want to change this, for example to see more decimals, you can do:
In [13]: geopandas.options.display_precision = 9

In [14]: world['centroid_column'].head()
Out[14]:
0    POINT (163.853164645 -17.316309426)
1      POINT (34.752989855 -6.257732429)
2     POINT (-12.137831112 24.291172960)
3     POINT (-98.142381372 61.469076145)
4    POINT (-112.599435912 45.705628002)
Name: centroid_column, dtype: geometry