Note
Plotting with Geoplot and GeoPandas#
Geoplot is a Python library providing a selection of easy-to-use geospatial visualizations. It is built on top of the lower-level CartoPy, covered in a separate section of this tutorial, and is designed to work with GeoPandas input.
This example is a brief tour of the geoplot API. For more details on the library refer to its documentation.
First we’ll load in the data using GeoPandas.
[1]:
import geopandas
import geodatasets
import geoplot

world = geopandas.read_file("https://naciscdn.org/naturalearth/110m/cultural/ne_110m_admin_0_countries.zip")
boroughs = geopandas.read_file(geoplot.datasets.get_path("nyc_boroughs"))
collisions = geopandas.read_file(geoplot.datasets.get_path("nyc_injurious_collisions"))
ERROR 1: PROJ: proj_create_from_database: Open of /home/docs/checkouts/readthedocs.org/user_builds/geopandas/conda/stable/share/proj failed
Plotting with Geoplot#
We start out by replicating the basic GeoPandas world plot using Geoplot.
[2]:
geoplot.polyplot(world, figsize=(8, 4))
---------------------------------------------------------------------------
TypeError                                 Traceback (most recent call last)
File ~/checkouts/readthedocs.org/user_builds/geopandas/conda/stable/lib/python3.11/site-packages/geoplot/geoplot.py:885, in polyplot.<locals>.PolyPlot.draw(self)
    884 try:  # Duck test for MultiPolygon.
--> 885     for subgeom in geom:
    886         feature = GeopandasPolygonPatch(
    887             subgeom, facecolor=facecolor, edgecolor=edgecolor, zorder=zorder,
    888             **kwargs
    889         )

TypeError: 'MultiPolygon' object is not iterable

During handling of the above exception, another exception occurred:

AttributeError                            Traceback (most recent call last)
Cell In[2], line 1
----> 1 geoplot.polyplot(world, figsize=(8, 4))

File ~/checkouts/readthedocs.org/user_builds/geopandas/conda/stable/lib/python3.11/site-packages/geoplot/geoplot.py:901, in polyplot(df, projection, extent, figsize, ax, **kwargs)
    898         return ax
    900 plot = PolyPlot(df, figsize=figsize, ax=ax, extent=extent, projection=projection, **kwargs)
--> 901 return plot.draw()

File ~/checkouts/readthedocs.org/user_builds/geopandas/conda/stable/lib/python3.11/site-packages/geoplot/geoplot.py:892, in polyplot.<locals>.PolyPlot.draw(self)
    890                 ax.add_patch(feature)
    891         except (TypeError, AssertionError):  # Shapely Polygon.
--> 892             feature = GeopandasPolygonPatch(
    893                 geom, facecolor=facecolor, edgecolor=edgecolor, zorder=zorder,
    894                 **kwargs
    895             )
    896             ax.add_patch(feature)
    898 return ax

File ~/checkouts/readthedocs.org/user_builds/geopandas/conda/stable/lib/python3.11/site-packages/geopandas/plotting.py:130, in _PolygonPatch(polygon, **kwargs)
    126 from matplotlib.patches import PathPatch
    127 from matplotlib.path import Path
    129 path = Path.make_compound_path(
--> 130     Path(np.asarray(polygon.exterior.coords)[:, :2]),
    131     *[Path(np.asarray(ring.coords)[:, :2]) for ring in polygon.interiors],
    132 )
    133 return PathPatch(path, **kwargs)

AttributeError: 'MultiPolygon' object has no attribute 'exterior'

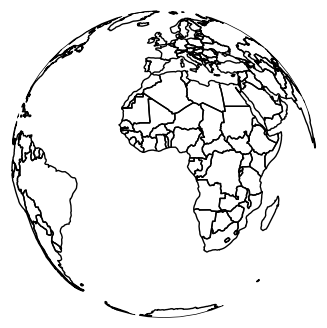
Geoplot can re-project data into any of the map projections provided by CartoPy (see the list here).
[3]:
# use the Orthographic map projection (e.g. a world globe)
ax = geoplot.polyplot(world, projection=geoplot.crs.Orthographic(), figsize=(8, 4))
ax.outline_patch.set_visible(True)
/home/docs/checkouts/readthedocs.org/user_builds/geopandas/conda/stable/lib/python3.11/site-packages/geoplot/geoplot.py:703: UserWarning: Plot extent lies outside of the Orthographic projection's viewport. Defaulting to global extent.
  warnings.warn(
---------------------------------------------------------------------------
AttributeError                            Traceback (most recent call last)
Cell In[3], line 3
      1 # use the Orthographic map projection (e.g. a world globe)
      2 ax = geoplot.polyplot(world, projection=geoplot.crs.Orthographic(), figsize=(8, 4))
----> 3 ax.outline_patch.set_visible(True)

AttributeError: 'GeoAxes' object has no attribute 'outline_patch'
polyplot is trivial and can only plot the geometries you pass to it. If you want to use color as a visual variable, specify a choropleth. Here we sort GDP per person by country into five buckets by color, using “quantiles” binning from the Mapclassify library.
[4]:
import mapclassify

gpd_per_person = world["gdp_md_est"] / world["pop_est"]
scheme = mapclassify.Quantiles(gpd_per_person, k=5)

# Note: this code sample requires geoplot>=0.4.0.
geoplot.choropleth(
    world, hue=gpd_per_person, scheme=scheme, cmap="Greens", figsize=(8, 4)
)
---------------------------------------------------------------------------
KeyError                                  Traceback (most recent call last)
File ~/checkouts/readthedocs.org/user_builds/geopandas/conda/stable/lib/python3.11/site-packages/pandas/core/indexes/base.py:3802, in Index.get_loc(self, key)
   3801 try:
-> 3802     return self._engine.get_loc(casted_key)
   3803 except KeyError as err:

File index.pyx:153, in pandas._libs.index.IndexEngine.get_loc()

File index.pyx:182, in pandas._libs.index.IndexEngine.get_loc()

File pandas/_libs/hashtable_class_helper.pxi:7081, in pandas._libs.hashtable.PyObjectHashTable.get_item()

File pandas/_libs/hashtable_class_helper.pxi:7089, in pandas._libs.hashtable.PyObjectHashTable.get_item()

KeyError: 'gdp_md_est'

The above exception was the direct cause of the following exception:

KeyError                                  Traceback (most recent call last)
Cell In[4], line 3
      1 import mapclassify
----> 3 gpd_per_person = world["gdp_md_est"] / world["pop_est"]
      4 scheme = mapclassify.Quantiles(gpd_per_person, k=5)
      6 # Note: this code sample requires geoplot>=0.4.0.

File ~/checkouts/readthedocs.org/user_builds/geopandas/conda/stable/lib/python3.11/site-packages/geopandas/geodataframe.py:1456, in GeoDataFrame.__getitem__(self, key)
   1450 def __getitem__(self, key):
   1451     """
   1452     If the result is a column containing only 'geometry', return a
   1453     GeoSeries. If it's a DataFrame with any columns of GeometryDtype,
   1454     return a GeoDataFrame.
   1455     """
-> 1456     result = super().__getitem__(key)
   1457     # Custom logic to avoid waiting for pandas GH51895
   1458     # result is not geometry dtype for multi-indexes
   1459     if (
   1460         pd.api.types.is_scalar(key)
   1461         and key == ""
   (...)
   1464         and not is_geometry_type(result)
   1465     ):

File ~/checkouts/readthedocs.org/user_builds/geopandas/conda/stable/lib/python3.11/site-packages/pandas/core/frame.py:4090, in DataFrame.__getitem__(self, key)
   4088 if self.columns.nlevels > 1:
   4089     return self._getitem_multilevel(key)
-> 4090 indexer = self.columns.get_loc(key)
   4091 if is_integer(indexer):
   4092     indexer = [indexer]

File ~/checkouts/readthedocs.org/user_builds/geopandas/conda/stable/lib/python3.11/site-packages/pandas/core/indexes/base.py:3809, in Index.get_loc(self, key)
   3804     if isinstance(casted_key, slice) or (
   3805         isinstance(casted_key, abc.Iterable)
   3806         and any(isinstance(x, slice) for x in casted_key)
   3807     ):
   3808         raise InvalidIndexError(key)
-> 3809     raise KeyError(key) from err
   3810 except TypeError:
   3811     # If we have a listlike key, _check_indexing_error will raise
   3812     #  InvalidIndexError. Otherwise we fall through and re-raise
   3813     #  the TypeError.
   3814     self._check_indexing_error(key)

KeyError: 'gdp_md_est'
If you want to use size as a visual variable, use a cartogram. Here are population estimates for countries in Africa.
[5]:
africa = world.query('continent == "Africa"')
ax = geoplot.cartogram(
    africa, scale="pop_est", limits=(0.2, 1), edgecolor="None", figsize=(7, 8)
)
geoplot.polyplot(africa, edgecolor="gray", ax=ax)
---------------------------------------------------------------------------
KeyError                                  Traceback (most recent call last)
File ~/checkouts/readthedocs.org/user_builds/geopandas/conda/stable/lib/python3.11/site-packages/pandas/core/computation/scope.py:231, in Scope.resolve(self, key, is_local)
    230 if self.has_resolvers:
--> 231     return self.resolvers[key]
    233 # if we're here that means that we have no locals and we also have
    234 # no resolvers

File ~/checkouts/readthedocs.org/user_builds/geopandas/conda/stable/lib/python3.11/collections/__init__.py:1006, in ChainMap.__getitem__(self, key)
   1005         pass
-> 1006 return self.__missing__(key)

File ~/checkouts/readthedocs.org/user_builds/geopandas/conda/stable/lib/python3.11/collections/__init__.py:998, in ChainMap.__missing__(self, key)
    997 def __missing__(self, key):
--> 998     raise KeyError(key)

KeyError: 'continent'

During handling of the above exception, another exception occurred:

KeyError                                  Traceback (most recent call last)
File ~/checkouts/readthedocs.org/user_builds/geopandas/conda/stable/lib/python3.11/site-packages/pandas/core/computation/scope.py:242, in Scope.resolve(self, key, is_local)
    238 try:
    239     # last ditch effort we look in temporaries
    240     # these are created when parsing indexing expressions
    241     # e.g., df[df > 0]
--> 242     return self.temps[key]
    243 except KeyError as err:

KeyError: 'continent'

The above exception was the direct cause of the following exception:

UndefinedVariableError                    Traceback (most recent call last)
Cell In[5], line 1
----> 1 africa = world.query('continent == "Africa"')
      2 ax = geoplot.cartogram(
      3     africa, scale="pop_est", limits=(0.2, 1), edgecolor="None", figsize=(7, 8)
      4 )
      5 geoplot.polyplot(africa, edgecolor="gray", ax=ax)

File ~/checkouts/readthedocs.org/user_builds/geopandas/conda/stable/lib/python3.11/site-packages/pandas/core/frame.py:4811, in DataFrame.query(self, expr, inplace, **kwargs)
   4809 kwargs["level"] = kwargs.pop("level", 0) + 1
   4810 kwargs["target"] = None
-> 4811 res = self.eval(expr, **kwargs)
   4813 try:
   4814     result = self.loc[res]

File ~/checkouts/readthedocs.org/user_builds/geopandas/conda/stable/lib/python3.11/site-packages/pandas/core/frame.py:4937, in DataFrame.eval(self, expr, inplace, **kwargs)
   4934     kwargs["target"] = self
   4935 kwargs["resolvers"] = tuple(kwargs.get("resolvers", ())) + resolvers
-> 4937 return _eval(expr, inplace=inplace, **kwargs)

File ~/checkouts/readthedocs.org/user_builds/geopandas/conda/stable/lib/python3.11/site-packages/pandas/core/computation/eval.py:336, in eval(expr, parser, engine, local_dict, global_dict, resolvers, level, target, inplace)
    327 # get our (possibly passed-in) scope
    328 env = ensure_scope(
    329     level + 1,
    330     global_dict=global_dict,
   (...)
    333     target=target,
    334 )
--> 336 parsed_expr = Expr(expr, engine=engine, parser=parser, env=env)
    338 if engine == "numexpr" and (
    339     is_extension_array_dtype(parsed_expr.terms.return_type)
    340     or getattr(parsed_expr.terms, "operand_types", None) is not None
   (...)
    344     )
    345 ):
    346     warnings.warn(
    347         "Engine has switched to 'python' because numexpr does not support "
    348         "extension array dtypes. Please set your engine to python manually.",
    349         RuntimeWarning,
    350         stacklevel=find_stack_level(),
    351     )

File ~/checkouts/readthedocs.org/user_builds/geopandas/conda/stable/lib/python3.11/site-packages/pandas/core/computation/expr.py:809, in Expr.__init__(self, expr, engine, parser, env, level)
    807 self.parser = parser
    808 self._visitor = PARSERS[parser](self.env, self.engine, self.parser)
--> 809 self.terms = self.parse()

File ~/checkouts/readthedocs.org/user_builds/geopandas/conda/stable/lib/python3.11/site-packages/pandas/core/computation/expr.py:828, in Expr.parse(self)
    824 def parse(self):
    825     """
    826     Parse an expression.
    827     """
--> 828     return self._visitor.visit(self.expr)

File ~/checkouts/readthedocs.org/user_builds/geopandas/conda/stable/lib/python3.11/site-packages/pandas/core/computation/expr.py:412, in BaseExprVisitor.visit(self, node, **kwargs)
    410 method = f"visit_{type(node).__name__}"
    411 visitor = getattr(self, method)
--> 412 return visitor(node, **kwargs)

File ~/checkouts/readthedocs.org/user_builds/geopandas/conda/stable/lib/python3.11/site-packages/pandas/core/computation/expr.py:418, in BaseExprVisitor.visit_Module(self, node, **kwargs)
    416     raise SyntaxError("only a single expression is allowed")
    417 expr = node.body[0]
--> 418 return self.visit(expr, **kwargs)

File ~/checkouts/readthedocs.org/user_builds/geopandas/conda/stable/lib/python3.11/site-packages/pandas/core/computation/expr.py:412, in BaseExprVisitor.visit(self, node, **kwargs)
    410 method = f"visit_{type(node).__name__}"
    411 visitor = getattr(self, method)
--> 412 return visitor(node, **kwargs)

File ~/checkouts/readthedocs.org/user_builds/geopandas/conda/stable/lib/python3.11/site-packages/pandas/core/computation/expr.py:421, in BaseExprVisitor.visit_Expr(self, node, **kwargs)
    420 def visit_Expr(self, node, **kwargs):
--> 421     return self.visit(node.value, **kwargs)

File ~/checkouts/readthedocs.org/user_builds/geopandas/conda/stable/lib/python3.11/site-packages/pandas/core/computation/expr.py:412, in BaseExprVisitor.visit(self, node, **kwargs)
    410 method = f"visit_{type(node).__name__}"
    411 visitor = getattr(self, method)
--> 412 return visitor(node, **kwargs)

File ~/checkouts/readthedocs.org/user_builds/geopandas/conda/stable/lib/python3.11/site-packages/pandas/core/computation/expr.py:719, in BaseExprVisitor.visit_Compare(self, node, **kwargs)
    717     op = self.translate_In(ops[0])
    718     binop = ast.BinOp(op=op, left=node.left, right=comps[0])
--> 719     return self.visit(binop)
    721 # recursive case: we have a chained comparison, a CMP b CMP c, etc.
    722 left = node.left

File ~/checkouts/readthedocs.org/user_builds/geopandas/conda/stable/lib/python3.11/site-packages/pandas/core/computation/expr.py:412, in BaseExprVisitor.visit(self, node, **kwargs)
    410 method = f"visit_{type(node).__name__}"
    411 visitor = getattr(self, method)
--> 412 return visitor(node, **kwargs)

File ~/checkouts/readthedocs.org/user_builds/geopandas/conda/stable/lib/python3.11/site-packages/pandas/core/computation/expr.py:532, in BaseExprVisitor.visit_BinOp(self, node, **kwargs)
    531 def visit_BinOp(self, node, **kwargs):
--> 532     op, op_class, left, right = self._maybe_transform_eq_ne(node)
    533     left, right = self._maybe_downcast_constants(left, right)
    534     return self._maybe_evaluate_binop(op, op_class, left, right)

File ~/checkouts/readthedocs.org/user_builds/geopandas/conda/stable/lib/python3.11/site-packages/pandas/core/computation/expr.py:452, in BaseExprVisitor._maybe_transform_eq_ne(self, node, left, right)
    450 def _maybe_transform_eq_ne(self, node, left=None, right=None):
    451     if left is None:
--> 452         left = self.visit(node.left, side="left")
    453     if right is None:
    454         right = self.visit(node.right, side="right")

File ~/checkouts/readthedocs.org/user_builds/geopandas/conda/stable/lib/python3.11/site-packages/pandas/core/computation/expr.py:412, in BaseExprVisitor.visit(self, node, **kwargs)
    410 method = f"visit_{type(node).__name__}"
    411 visitor = getattr(self, method)
--> 412 return visitor(node, **kwargs)

File ~/checkouts/readthedocs.org/user_builds/geopandas/conda/stable/lib/python3.11/site-packages/pandas/core/computation/expr.py:545, in BaseExprVisitor.visit_Name(self, node, **kwargs)
    544 def visit_Name(self, node, **kwargs) -> Term:
--> 545     return self.term_type(node.id, self.env, **kwargs)

File ~/checkouts/readthedocs.org/user_builds/geopandas/conda/stable/lib/python3.11/site-packages/pandas/core/computation/ops.py:91, in Term.__init__(self, name, env, side, encoding)
     89 tname = str(name)
     90 self.is_local = tname.startswith(LOCAL_TAG) or tname in DEFAULT_GLOBALS
---> 91 self._value = self._resolve_name()
     92 self.encoding = encoding

File ~/checkouts/readthedocs.org/user_builds/geopandas/conda/stable/lib/python3.11/site-packages/pandas/core/computation/ops.py:115, in Term._resolve_name(self)
    110 if local_name in self.env.scope and isinstance(
    111     self.env.scope[local_name], type
    112 ):
    113     is_local = False
--> 115 res = self.env.resolve(local_name, is_local=is_local)
    116 self.update(res)
    118 if hasattr(res, "ndim") and res.ndim > 2:

File ~/checkouts/readthedocs.org/user_builds/geopandas/conda/stable/lib/python3.11/site-packages/pandas/core/computation/scope.py:244, in Scope.resolve(self, key, is_local)
    242     return self.temps[key]
    243 except KeyError as err:
--> 244     raise UndefinedVariableError(key, is_local) from err

UndefinedVariableError: name 'continent' is not defined
If we have data in the shape of points in space, we may generate a three-dimensional heatmap on it using kdeplot.
[6]:
ax = geoplot.kdeplot(
    collisions.head(1000),
    clip=boroughs.geometry,
    shade=True,
    cmap="Reds",
    projection=geoplot.crs.AlbersEqualArea(),
)
geoplot.polyplot(boroughs, ax=ax, zorder=1)
/home/docs/checkouts/readthedocs.org/user_builds/geopandas/conda/stable/lib/python3.11/site-packages/geoplot/geoplot.py:1304: FutureWarning:

`shade` is now deprecated in favor of `fill`; setting `fill=True`.
This will become an error in seaborn v0.14.0; please update your code.

  sns.kdeplot(
---------------------------------------------------------------------------
AttributeError                            Traceback (most recent call last)
Cell In[6], line 1
----> 1 ax = geoplot.kdeplot(
      2     collisions.head(1000),
      3     clip=boroughs.geometry,
      4     shade=True,
      5     cmap="Reds",
      6     projection=geoplot.crs.AlbersEqualArea(),
      7 )
      8 geoplot.polyplot(boroughs, ax=ax, zorder=1)

File ~/checkouts/readthedocs.org/user_builds/geopandas/conda/stable/lib/python3.11/site-packages/geoplot/geoplot.py:1320, in kdeplot(df, projection, extent, figsize, ax, clip, **kwargs)
   1315         return ax
   1317 plot = KDEPlot(
   1318     df, projection=projection, extent=extent, figsize=figsize, ax=ax, clip=clip, **kwargs
   1319 )
-> 1320 return plot.draw()

File ~/checkouts/readthedocs.org/user_builds/geopandas/conda/stable/lib/python3.11/site-packages/geoplot/geoplot.py:1304, in kdeplot.<locals>.KDEPlot.draw(self)
   1301     return ax
   1303 if self.projection:
-> 1304     sns.kdeplot(
   1305         x=pd.Series([p.x for p in self.df.geometry]),
   1306         y=pd.Series([p.y for p in self.df.geometry]),
   1307         transform=ccrs.PlateCarree(), ax=ax, **self.kwargs
   1308     )
   1309 else:
   1310     sns.kdeplot(
   1311         x=pd.Series([p.x for p in self.df.geometry]),
   1312         y=pd.Series([p.y for p in self.df.geometry]),
   1313         ax=ax, **self.kwargs
   1314     )

File ~/checkouts/readthedocs.org/user_builds/geopandas/conda/stable/lib/python3.11/site-packages/seaborn/distributions.py:1682, in kdeplot(data, x, y, hue, weights, palette, hue_order, hue_norm, color, fill, multiple, common_norm, common_grid, cumulative, bw_method, bw_adjust, warn_singular, log_scale, levels, thresh, gridsize, cut, clip, legend, cbar, cbar_ax, cbar_kws, ax, **kwargs)
   1679 p._attach(ax, allowed_types=["numeric", "datetime"], log_scale=log_scale)
   1681 method = ax.fill_between if fill else ax.plot
-> 1682 color = _default_color(method, hue, color, kwargs)
   1684 if not p.has_xy_data:
   1685     return ax

File ~/checkouts/readthedocs.org/user_builds/geopandas/conda/stable/lib/python3.11/site-packages/seaborn/utils.py:136, in _default_color(method, hue, color, kws, saturation)
    133 elif method.__name__ == "fill_between":
    135     kws = normalize_kwargs(kws, mpl.collections.PolyCollection)
--> 136     scout = method([], [], **kws)
    137     facecolor = scout.get_facecolor()
    138     color = to_rgb(facecolor[0])

File ~/checkouts/readthedocs.org/user_builds/geopandas/conda/stable/lib/python3.11/site-packages/matplotlib/__init__.py:1465, in _preprocess_data.<locals>.inner(ax, data, *args, **kwargs)
   1462 @functools.wraps(func)
   1463 def inner(ax, *args, data=None, **kwargs):
   1464     if data is None:
-> 1465         return func(ax, *map(sanitize_sequence, args), **kwargs)
   1467     bound = new_sig.bind(ax, *args, **kwargs)
   1468     auto_label = (bound.arguments.get(label_namer)
   1469                   or bound.kwargs.get(label_namer))

File ~/checkouts/readthedocs.org/user_builds/geopandas/conda/stable/lib/python3.11/site-packages/matplotlib/axes/_axes.py:5509, in Axes.fill_between(self, x, y1, y2, where, interpolate, step, **kwargs)
   5507 def fill_between(self, x, y1, y2=0, where=None, interpolate=False,
   5508                  step=None, **kwargs):
-> 5509     return self._fill_between_x_or_y(
   5510         "x", x, y1, y2,
   5511         where=where, interpolate=interpolate, step=step, **kwargs)

File ~/checkouts/readthedocs.org/user_builds/geopandas/conda/stable/lib/python3.11/site-packages/matplotlib/axes/_axes.py:5500, in Axes._fill_between_x_or_y(self, ind_dir, ind, dep1, dep2, where, interpolate, step, **kwargs)
   5498 up_x = up_y = True
   5499 if "transform" in kwargs:
-> 5500     up_x, up_y = kwargs["transform"].contains_branch_seperately(self.transData)
   5501 self.update_datalim(pts, updatex=up_x, updatey=up_y)
   5503 self.add_collection(collection, autolim=False)

AttributeError: 'PlateCarree' object has no attribute 'contains_branch_seperately'

These are just some of the plots you can make with Geoplot. There are many other possibilities not covered in this brief introduction. For more examples, refer to the Gallery in the Geoplot documentation.