Geometric manipulations#
GeoPandas makes available all the tools for geometric manipulations in the Shapely library.
Note that documentation for all set-theoretic tools for creating new shapes using the relationship between two different spatial datasets – like creating intersections, or differences – can be found at Set operations with overlay.
Constructive methods#
- GeoSeries.buffer(distance, resolution=16)#
Returns a
GeoSeriesof geometries representing all points within a given distance of each geometric object.
- GeoSeries.boundary#
Returns a
GeoSeriesof lower dimensional objects representing each geometry’s set-theoretic boundary.
- GeoSeries.concave_hull#
Returns a
GeoSeriesof geometries representing the smallest concave Polygon containing all the points in each object unless the number of points in the object is less than three. For two points, the concave hull collapses to a LineString; for 1, a Point.
- GeoSeries.convex_hull#
Returns a
GeoSeriesof geometries representing the smallest convex Polygon containing all the points in each object unless the number of points in the object is less than three. For two points, the convex hull collapses to a LineString; for 1, a Point.
- GeoSeries.constrained_delaunay_triangles()#
Returns a
GeoSerieswith the constrained Delaunay triangulation of polygons. A constrained Delaunay triangulation requires the edges of the input polygon(s) to be in the set of resulting triangle edges. An unconstrained delaunay triangulation only triangulates based on the vertices, hence triangle edges could cross polygon boundaries.
- GeoSeries.delaunay_triangles(tolerance, preserve_topology=True)#
Returns a
GeoSeriesconsisting of polygons (default) or linestrings (only_edges=True) representing the computed Delaunay triangulation around the vertices of an input geometry.
- GeoSeries.envelope#
Returns a
GeoSeriesof geometries representing the point or smallest rectangular polygon (with sides parallel to the coordinate axes) that contains each object.
- GeoSeries.extract_unique_points()#
Returns a
GeoSeriesof geometries containing all distinct vertices of each input geometry as a multipoint.
- GeoSeries.offset_curve(distance, quad_segs=8, join_style='round', mitre_limit=5.0)#
Returns a
GeoSeriescontaining a Linestring or MultiLineString geometry at a distance from the object on its right or its left side.
- GeoSeries.remove_repeated_points()#
Returns a
GeoSeriescontaining a copy of the input geometry with repeated points removed.
- GeoSeries.simplify(tolerance, preserve_topology=True)#
Returns a
GeoSeriescontaining a simplified representation of each object.
Affine transformations#
- GeoSeries.affine_transform(self, matrix)#
Transform the geometries of the
GeoSeriesusing an affine transformation matrix
- GeoSeries.rotate(self, angle, origin='center', use_radians=False)#
Rotate the coordinates of the
GeoSeries.
- GeoSeries.scale(self, xfact=1.0, yfact=1.0, zfact=1.0, origin='center')#
Scale the geometries of the
GeoSeriesalong each (x, y, z) dimension.
Examples of geometric manipulations#
>>> import geopandas
>>> from geopandas import GeoSeries
>>> from shapely.geometry import Polygon
>>> p1 = Polygon([(0, 0), (1, 0), (1, 1)])
>>> p2 = Polygon([(0, 0), (1, 0), (1, 1), (0, 1)])
>>> p3 = Polygon([(2, 0), (3, 0), (3, 1), (2, 1)])
>>> g = GeoSeries([p1, p2, p3])
>>> g
0         POLYGON ((0 0, 1 0, 1 1, 0 0))
1    POLYGON ((0 0, 1 0, 1 1, 0 1, 0 0))
2    POLYGON ((2 0, 3 0, 3 1, 2 1, 2 0))
dtype: geometry
Some geographic operations return normal pandas objects. The area property of a GeoSeries will return a pandas.Series containing the area of each item in the GeoSeries:
>>> print(g.area)
0    0.5
1    1.0
2    1.0
dtype: float64
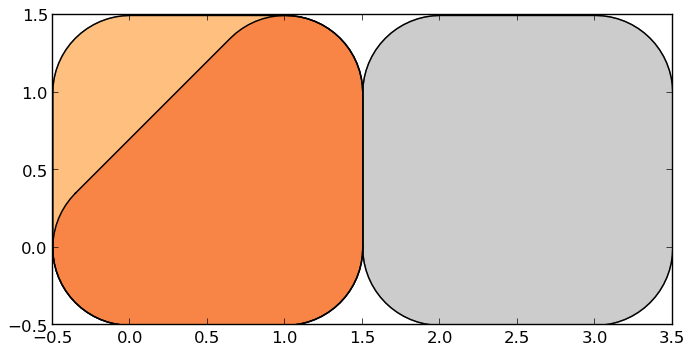
Other operations return GeoPandas objects:
>>> g.buffer(0.5)
0    POLYGON ((-0.3535533905932737 0.35355339059327...
1    POLYGON ((-0.5 0, -0.5 1, -0.4975923633360985 ...
2    POLYGON ((1.5 0, 1.5 1, 1.502407636663901 1.04...
dtype: geometry
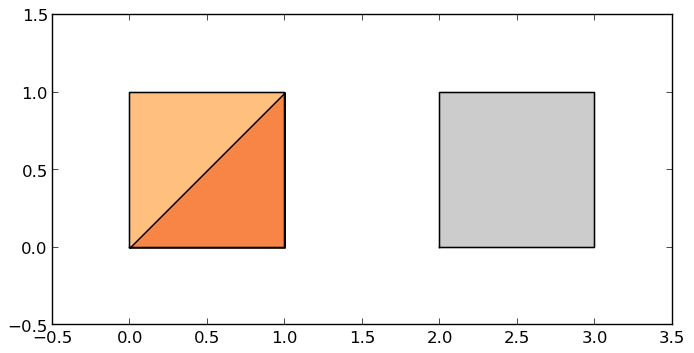
GeoPandas objects also know how to plot themselves. GeoPandas uses matplotlib for plotting. To generate a plot of a GeoSeries, use:
>>> g.plot()
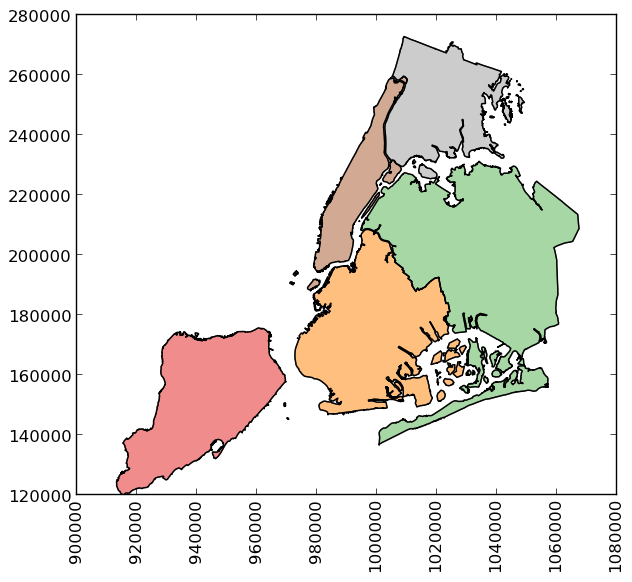
GeoPandas also implements alternate constructors that can read any data format recognized by Pyogrio. To read a zip file containing an ESRI shapefile with the borough boundaries of New York City (provided by the geodatasets package):
>>> import geodatasets
>>> nybb_path = geodatasets.get_path('nybb')
>>> boros = geopandas.read_file(nybb_path)
>>> boros.set_index('BoroCode', inplace=True)
>>> boros.sort_index(inplace=True)
>>> boros
               BoroName     Shape_Leng    Shape_Area  \
BoroCode
1             Manhattan  359299.096471  6.364715e+08
2                 Bronx  464392.991824  1.186925e+09
3              Brooklyn  741080.523166  1.937479e+09
4                Queens  896344.047763  3.045213e+09
5         Staten Island  330470.010332  1.623820e+09

                                                   geometry
BoroCode
1         MULTIPOLYGON (((981219.0557861328 188655.31579...
2         MULTIPOLYGON (((1012821.805786133 229228.26458...
3         MULTIPOLYGON (((1021176.479003906 151374.79699...
4         MULTIPOLYGON (((1029606.076599121 156073.81420...
5         MULTIPOLYGON (((970217.0223999023 145643.33221...
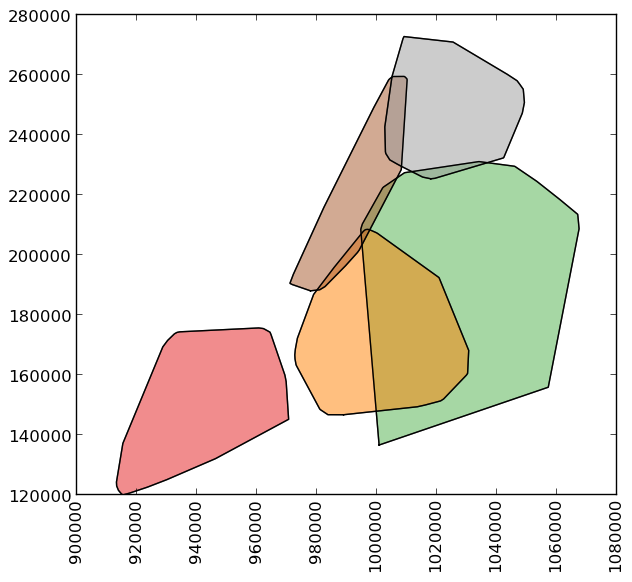
>>> boros['geometry'].convex_hull
BoroCode
1    POLYGON ((977855.4451904297 188082.3223876953,...
2    POLYGON ((1017949.977600098 225426.8845825195,...
3    POLYGON ((988872.8212280273 146772.0317993164,...
4    POLYGON ((1000721.531799316 136681.776184082, ...
5    POLYGON ((915517.6877458114 120121.8812543372,...
dtype: geometry
To demonstrate a more complex operation, generate a
GeoSeries containing 2000 random points:
>>> import numpy as np
>>> from shapely.geometry import Point
>>> xmin, xmax, ymin, ymax = 900000, 1080000, 120000, 280000
>>> xc = (xmax - xmin) * np.random.random(2000) + xmin
>>> yc = (ymax - ymin) * np.random.random(2000) + ymin
>>> pts = GeoSeries([Point(x, y) for x, y in zip(xc, yc)])
Now draw a circle with fixed radius around each point:
>>> circles = pts.buffer(2000)
You can collapse these circles into a single MultiPolygon
geometry with
>>> mp = circles.union_all()
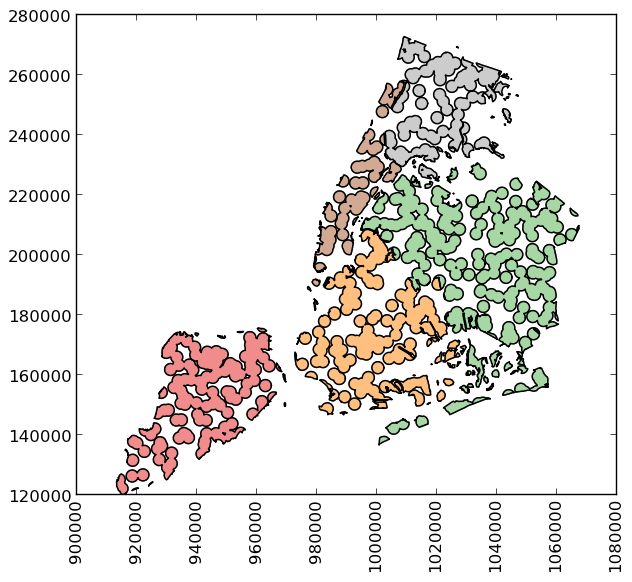
To extract the part of this geometry contained in each borough, you can just use:
>>> holes = boros['geometry'].intersection(mp)
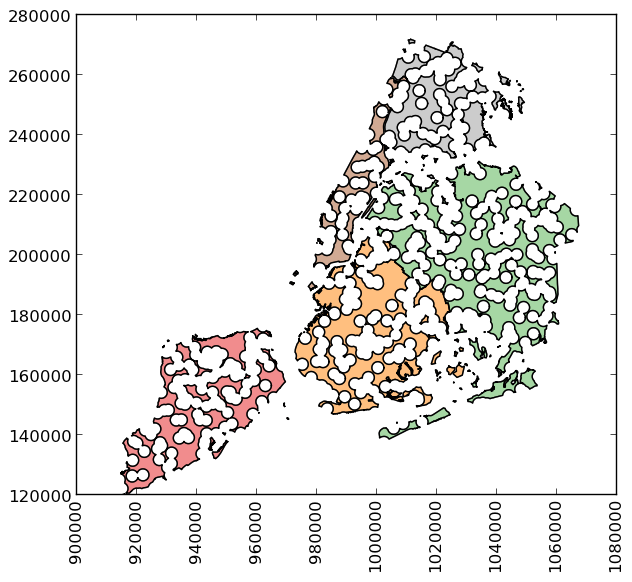
and to get the area outside of the holes:
>>> boros_with_holes = boros['geometry'].difference(mp)
Note that this can be simplified a bit, since geometry is
available as an attribute on a GeoDataFrame, and the
intersection() and difference() methods are implemented with the
“&” and “-” operators, respectively. For example, the latter could
have been expressed simply as boros.geometry - mp.
It’s easy to do things like calculate the fractional area in each borough that are in the holes:
>>> holes.area / boros.geometry.area
BoroCode
1    0.579939
2    0.586833
3    0.608174
4    0.582172
5    0.558075
dtype: float64