Aggregation with dissolve#
Spatial data are often more granular than needed. For example, you might have data on sub-national units, but you’re actually interested in studying patterns at the level of countries.
In a non-spatial setting, when you need summary statistics of the data, you can aggregate data using the groupby() function. But for spatial data, you sometimes also need to aggregate geometric features. In the GeoPandas library, you can aggregate geometric features using the dissolve() function.
dissolve() can be thought of as doing three things:
it dissolves all the geometries within a given group together into a single geometric feature (using the
union_all()method), andit aggregates all the rows of data in a group using groupby.aggregate, and
it combines those two results.
dissolve() Example#
Take example of administrative areas in Nepal. You have districts, which are smaller, and zones, which are larger. A group of districts always compose a single zone. Suppose you are interested in Nepalese zone, but you only have Nepalese district-level data like the geoda.nepal dataset included in geodatasets. You can easily convert this to a zone-level dataset.
First, let’s look at the most simple case where you just want zone shapes and names.
In [1]: import geodatasets

In [2]: nepal = geopandas.read_file(geodatasets.get_path('geoda.nepal'))

In [3]: nepal = nepal.rename(columns={"name_2": "zone"})  # rename to remember the column

In [4]: nepal[["zone", "geometry"]].head()
Out[4]:
          zone                                           geometry
0  Dhaualagiri  POLYGON ((83.10834 28.6202, 83.1056 28.60976, ...
1  Dhaualagiri  POLYGON ((83.99726 29.31675, 84 29.31576, 84 2...
2  Dhaualagiri  POLYGON ((83.50688 28.79306, 83.51024 28.78809...
3  Dhaualagiri  POLYGON ((83.70261 28.39837, 83.70435 28.39452...
4      Bagmati  POLYGON ((85.52173 27.71822, 85.52359 27.71375...
By default, dissolve() will pass 'first' to groupby.aggregate.
In [5]: nepal_zone = nepal[['zone', 'geometry']]
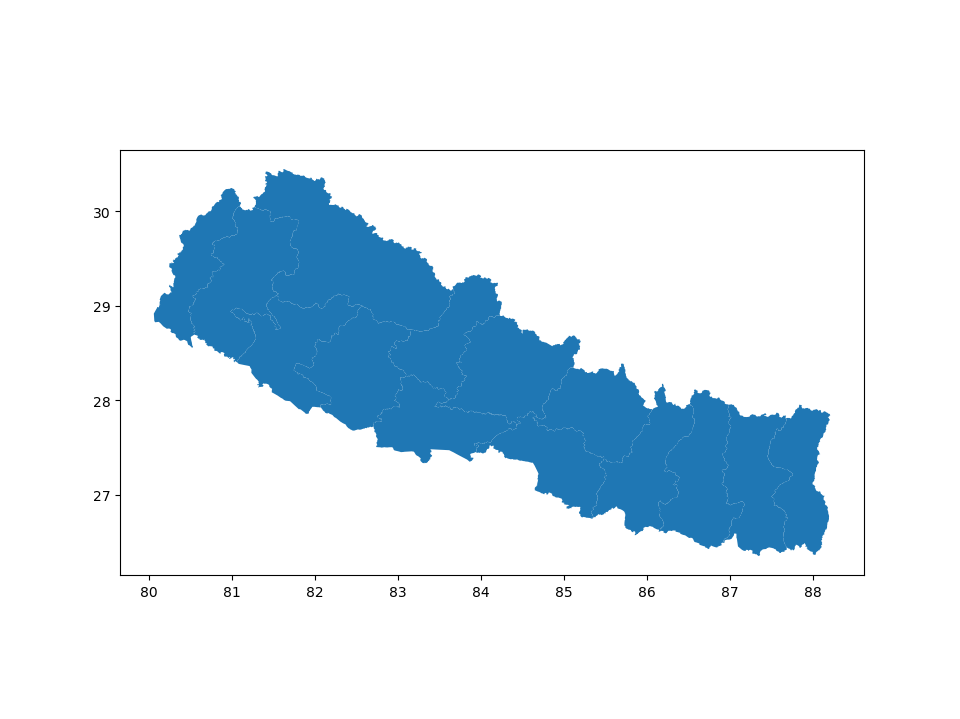
In [6]: zones = nepal_zone.dissolve(by='zone')
In [7]: zones.plot();
In [8]: zones.head()
Out[8]:
geometry
zone
Bagmati POLYGON ((85.87653 27.61234, 85.87355 27.60861...
Bheri POLYGON ((81.75089 28.31038, 81.75562 28.3074,...
Dhaualagiri POLYGON ((83.70647 28.39278, 83.70721 28.38781...
Gandaki POLYGON ((84.49995 28.74099, 84.50443 28.7441,...
Janakpur POLYGON ((86.26166 26.91417, 86.2588 26.91144,...
If you are interested in aggregate populations, however, you can pass different functions to the dissolve() method to aggregate populations using the aggfunc = argument:
In [9]: nepal_pop = nepal[['zone', 'geometry', 'population']]
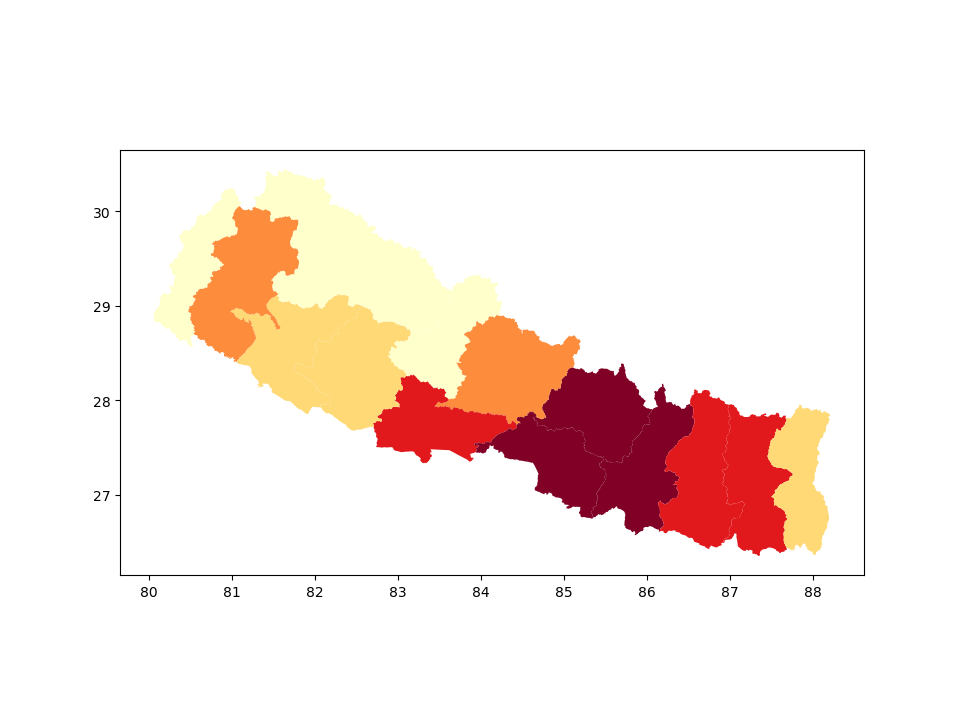
In [10]: zones = nepal_pop.dissolve(by='zone', aggfunc='sum')
In [11]: zones.plot(column = 'population', scheme='quantiles', cmap='YlOrRd');
In [12]: zones.head()
Out[12]:
geometry population
zone
Bagmati POLYGON ((85.87653 27.61234, 85.87355 27.60861... 3750441
Bheri POLYGON ((81.75089 28.31038, 81.75562 28.3074,... 1463510
Dhaualagiri POLYGON ((83.70647 28.39278, 83.70721 28.38781... 516905
Gandaki POLYGON ((84.49995 28.74099, 84.50443 28.7441,... 1530310
Janakpur POLYGON ((86.26166 26.91417, 86.2588 26.91144,... 2818356
Dissolve arguments#
The aggfunc = argument defaults to ‘first’ which means that the first row of attributes values found in the dissolve routine will be assigned to the resultant dissolved geodataframe.
However it also accepts other summary statistic options as allowed by pandas.groupby including:
‘first’
‘last’
‘min’
‘max’
‘sum’
‘mean’
‘median’
function
string function name
list of functions and/or function names, e.g. [np.sum, ‘mean’]
dict of axis labels -> functions, function names or list of such.
For example, to get the number of countries on each continent,
as well as the populations of the largest and smallest country of each,
you can aggregate the 'name' column using 'count',
and the 'pop_est' column using 'min' and 'max':
In [13]: zones = nepal.dissolve(
   ....:      by="zone",
   ....:      aggfunc={
   ....:          "district": "count",
   ....:          "population": ["min", "max"],
   ....:      },
   ....:  )
   ....: zones.head()
   ....:
Out[13]:
                                                      geometry  ...  (population, max)
zone                                                            ...
Bagmati      POLYGON ((85.87653 27.61234, 85.87355 27.60861...  ...            1688131
Bheri        POLYGON ((81.75089 28.31038, 81.75562 28.3074,...  ...             422812
Dhaualagiri  POLYGON ((83.70647 28.39278, 83.70721 28.38781...  ...             250065
Gandaki      POLYGON ((84.49995 28.74099, 84.50443 28.7441,...  ...             480851
Janakpur     POLYGON ((86.26166 26.91417, 86.2588 26.91144,...  ...             765959

[5 rows x 4 columns]